Build A Log Aggregation System in AWS
On This Page
Lab
Navigating to Your Cloud’s Lambda Function

1. In the AWS Management Console search bar, enter Cloud Formation, and click the CloudFormation result under Services:
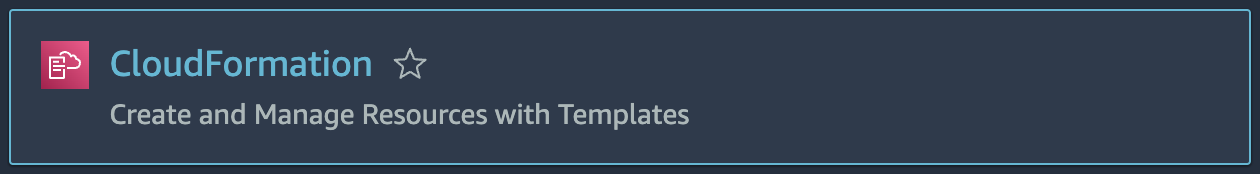
This will bring you to the CloudFormation Stacks table.
There will be one stack named cloudacademylabs in the table with a Status of CREATE_COMPLETE.
Note: If the stack hasn’t reached the Statusof CREATE_COMPLETE, try refreshing the page after a minute. It only takes a minute for the stack to fully create.
2. To view details of the stack, under Stack name, click the cloudacademylabs link.
3. Click the Resources tab:
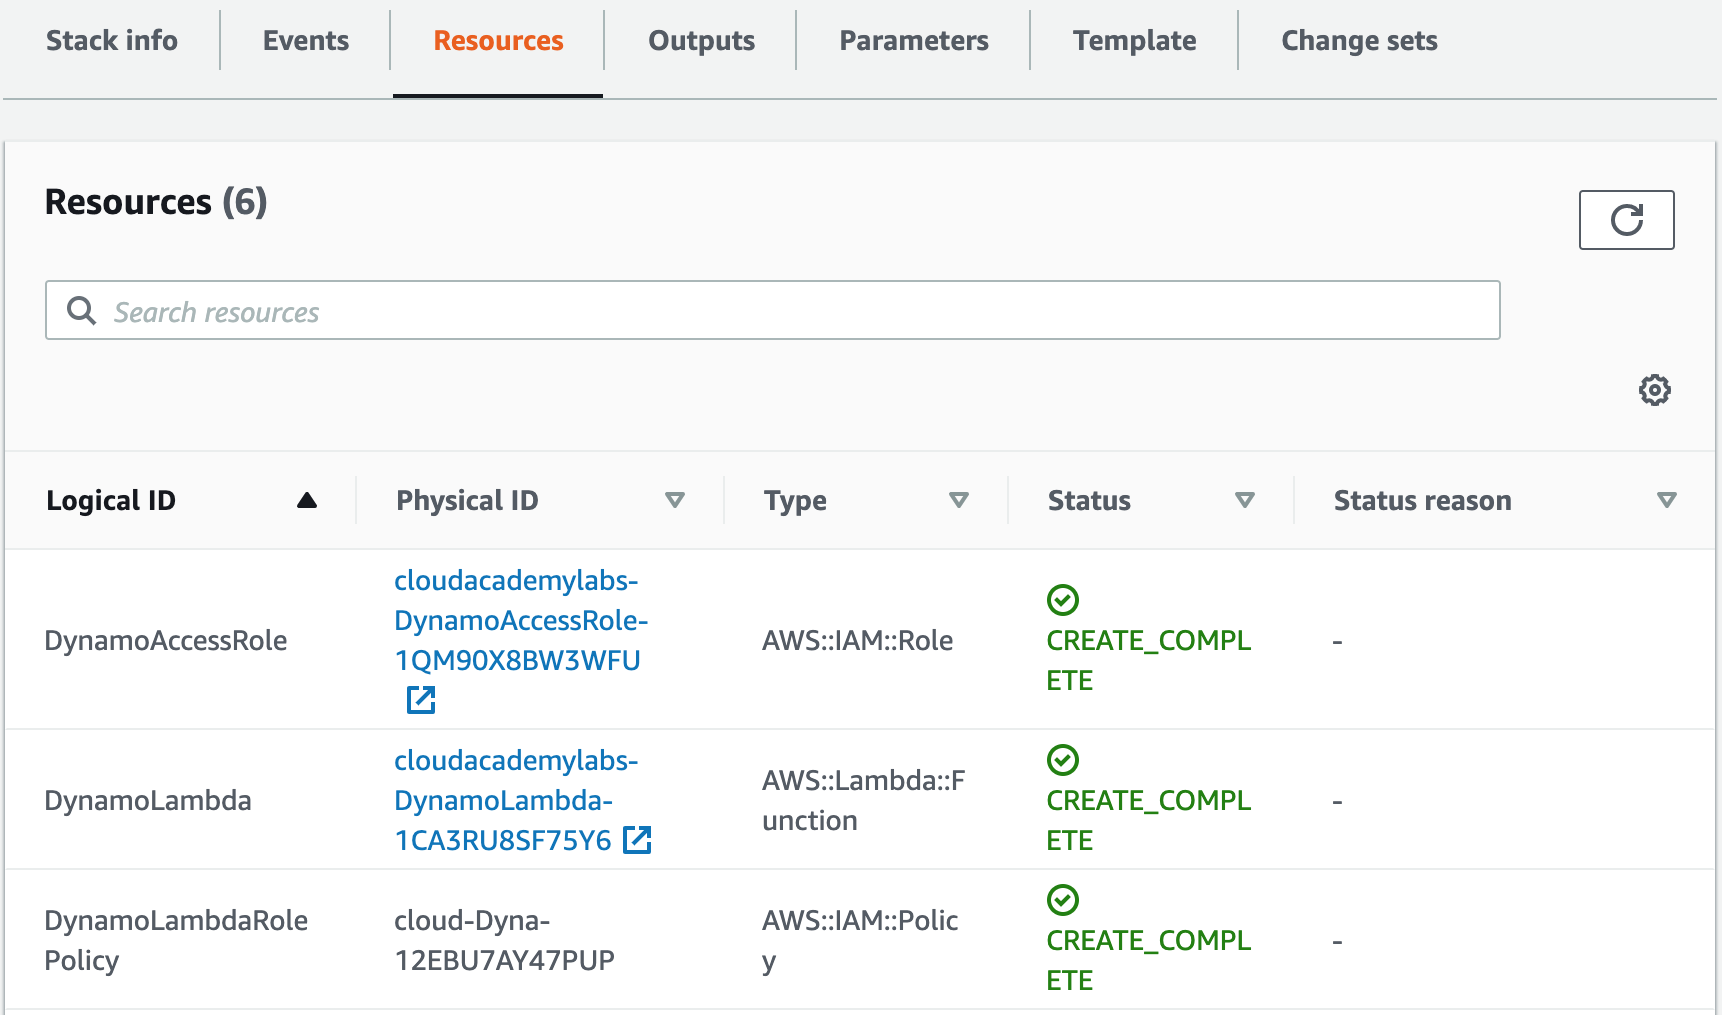
Your Physical IDs will be different than in the supplied image. Note in the Typecolumn that a DynamoDB Table, a Lambda Function, and IAMresources to grant the Lambda access to the DynamoDB Table have all been created. You will be querying the DynamoDB table via Lambda function invocations to create CloudWatch Logs, that will be aggregated and searchable via a user interface (UI).
4. Click on the Outputs tab, and open the DynamoLambdaConsoleLink link in the Value column:
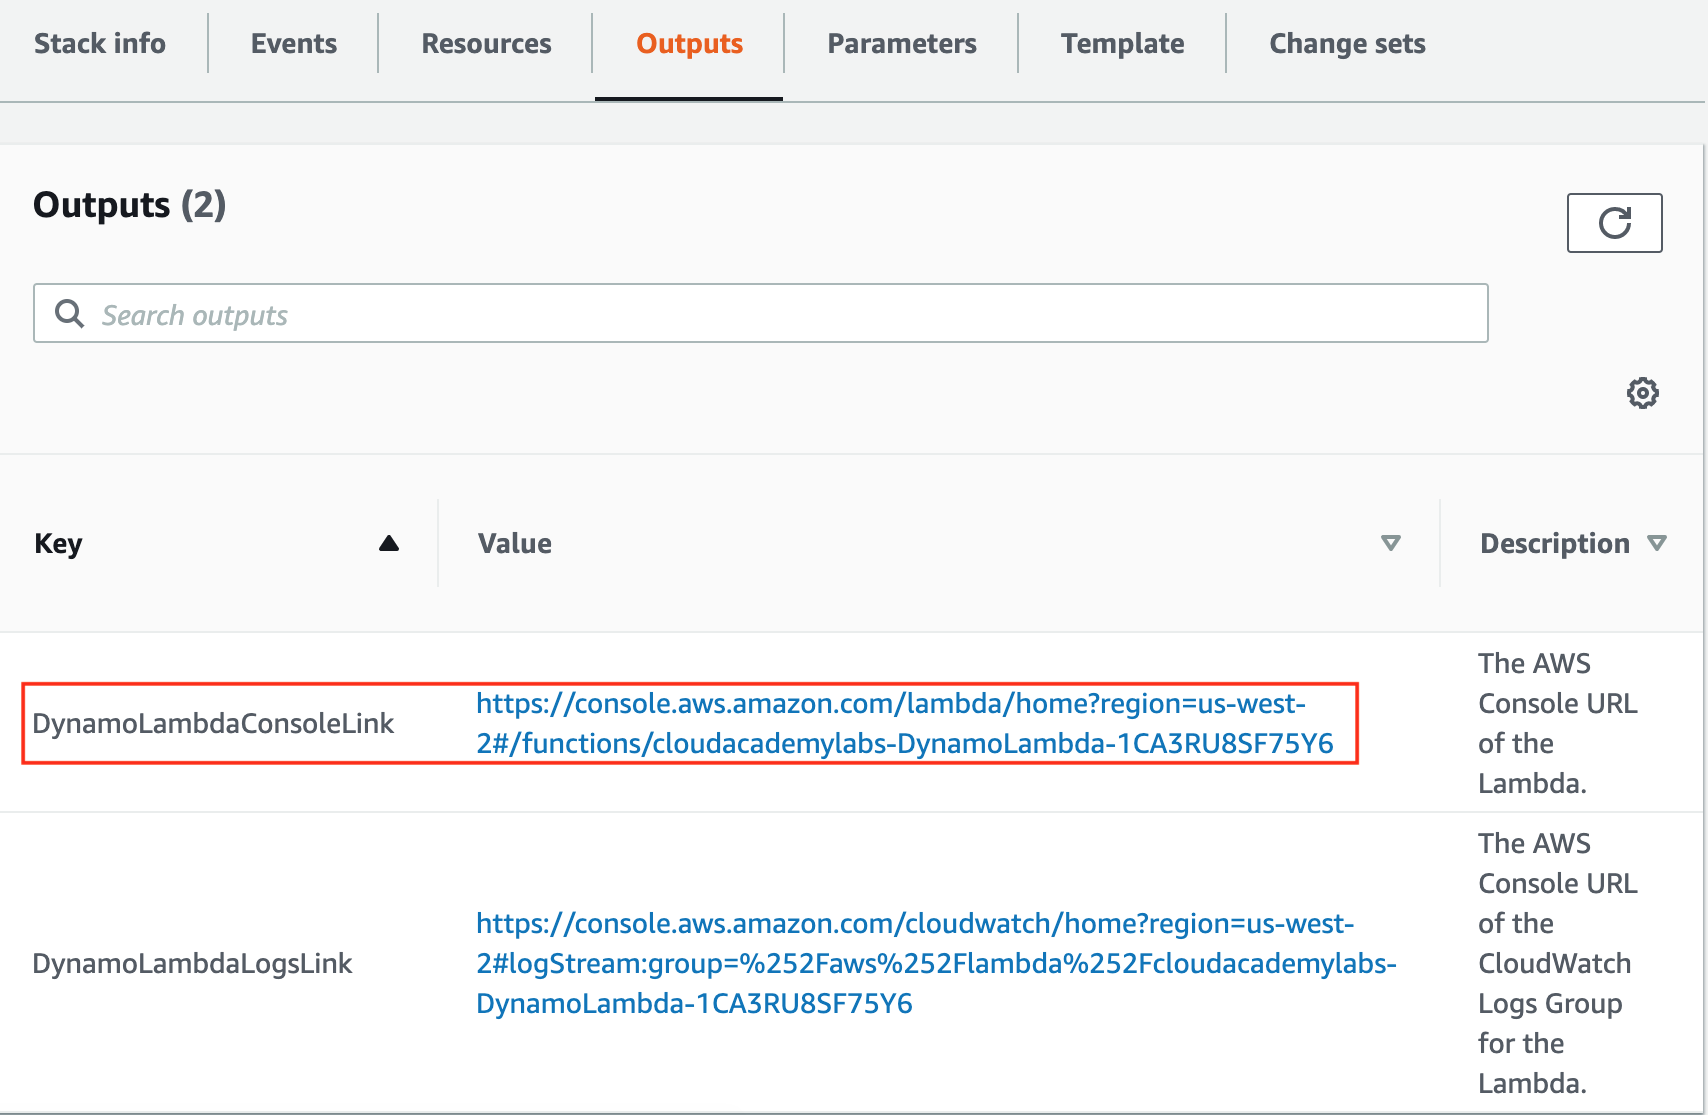
This takes you to the Lambda function Console.
Creating Some Logs Using AWS Lambda
1. Briefly look around the Lambda function console:
The Designergives a visual representation of the AWS resources that trigger the function (there are none in this case), and the AWS resources the function has access to (CloudWatch Logs, and DynamoDB). The actual code that is executed by the function is farther down in the Function codesection. You don’t need to worry about the actual implementation details of the function for this Lab.
2. To configure a test event to trigger the function, scroll down to the Code source section and click Test:
3. In the Configure test event form, enter the following values before scrolling to the bottom and click Save:
- Event name:TestPutEvent
- Enter the following in the code editor at the bottom of the form:
{
  "fn": "PUT",
  "data": {
    "id": "12345",
    "name": "foobar"
  }
}
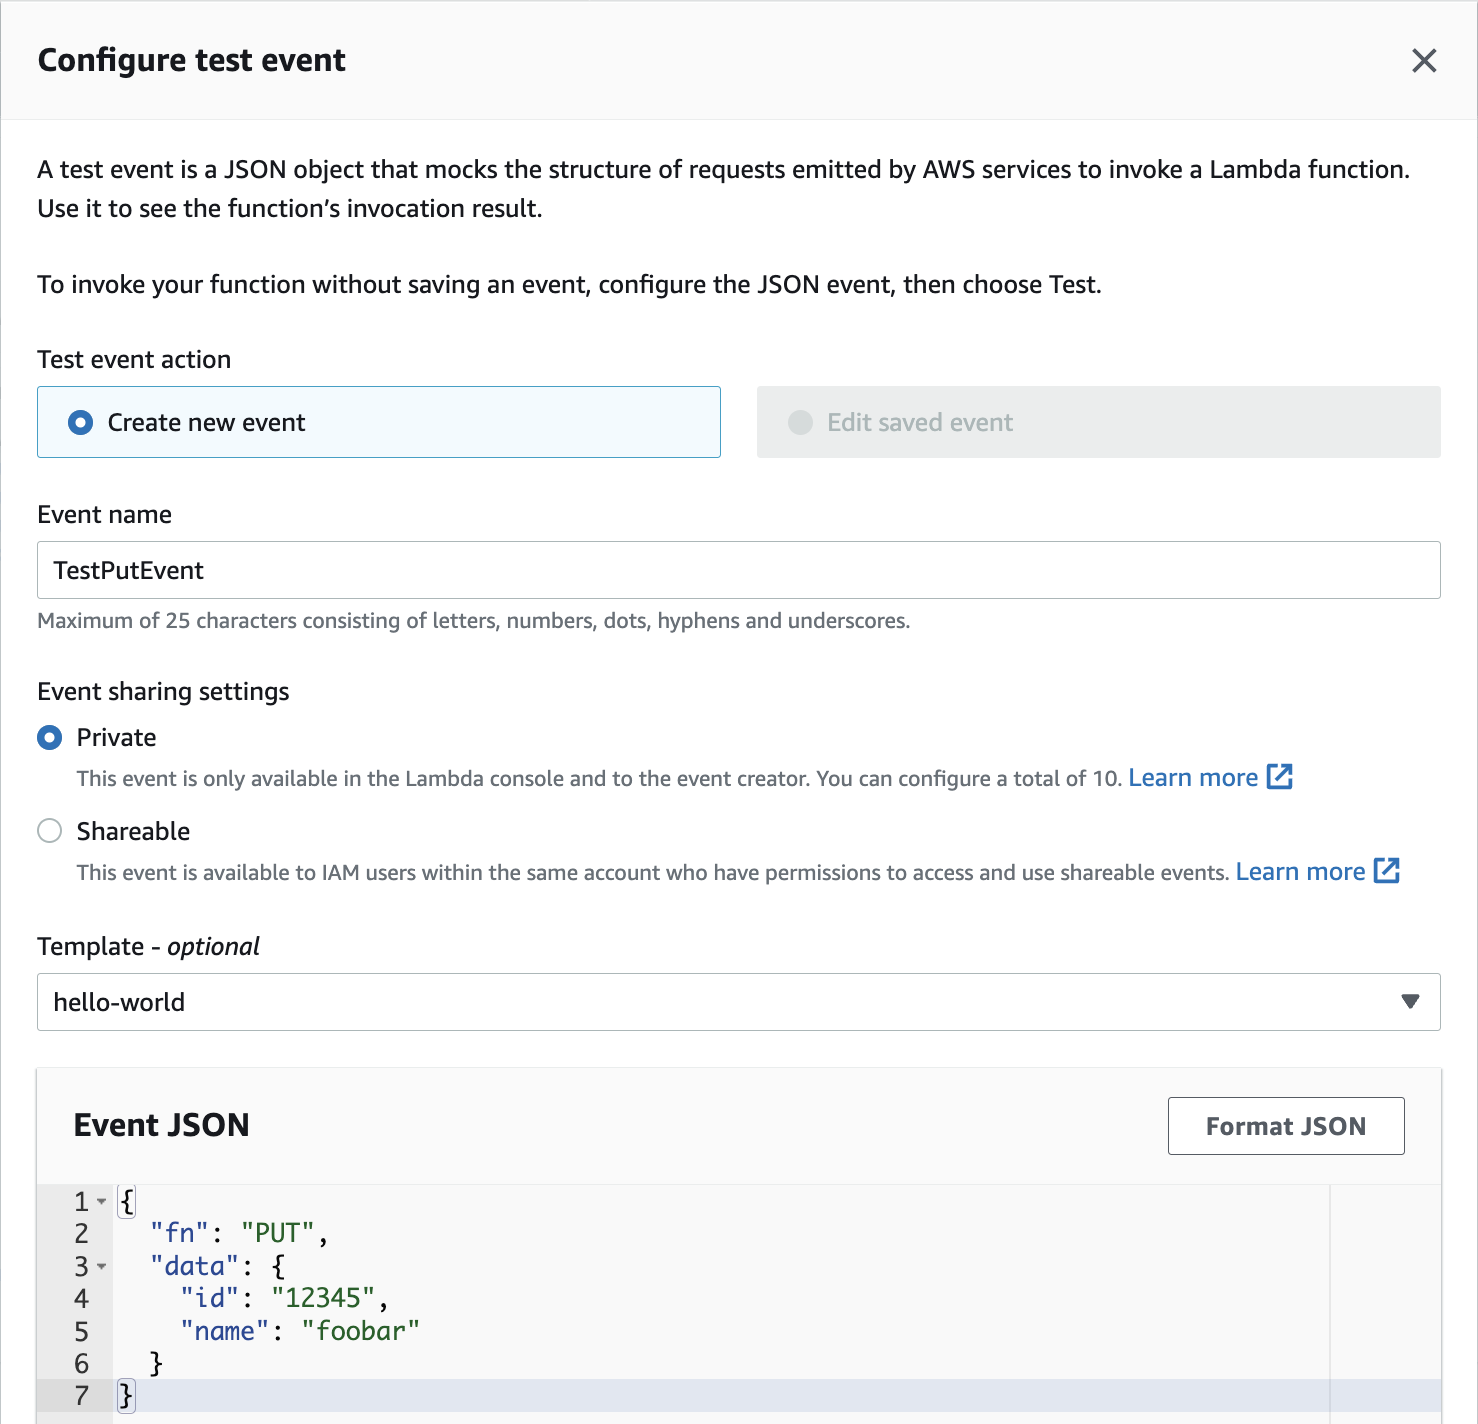
The PUT object event will update the DynamoDB database with an object with the given id.
4. To run your function with your test event, click Test again:
After a few seconds, in the code editor, a tab called Execution results will load:
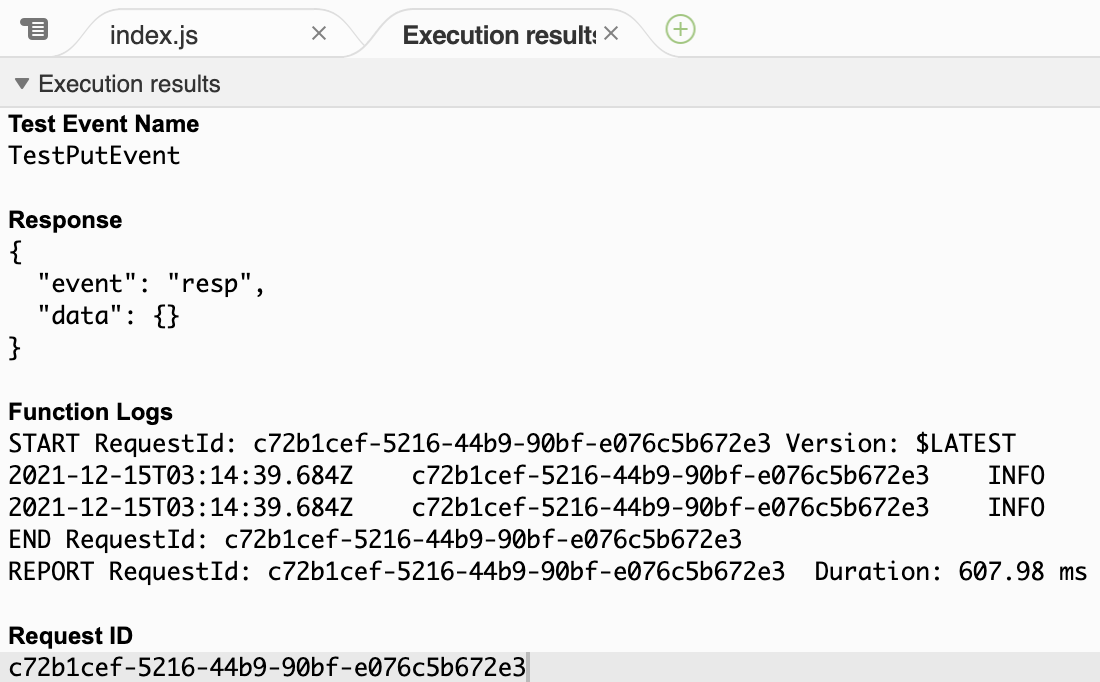
The function succeeded and the Function Logsarea displays the logs that were generated and automatically sent to CloudWatch Logs by AWS Lambda.
5. To view the Amazon CloudWatch logs, click the Monitor tab, and then click View logs in CloudWatch:
Note: The Lab’s CloudFormation stack outputs also include a link to the Log Group if you need to access it at a later time.
Manually Viewing Logs in Amazon CloudWatch
1. Observe the Log Streams in the CloudWatch log group for the Lambda function you invoked:
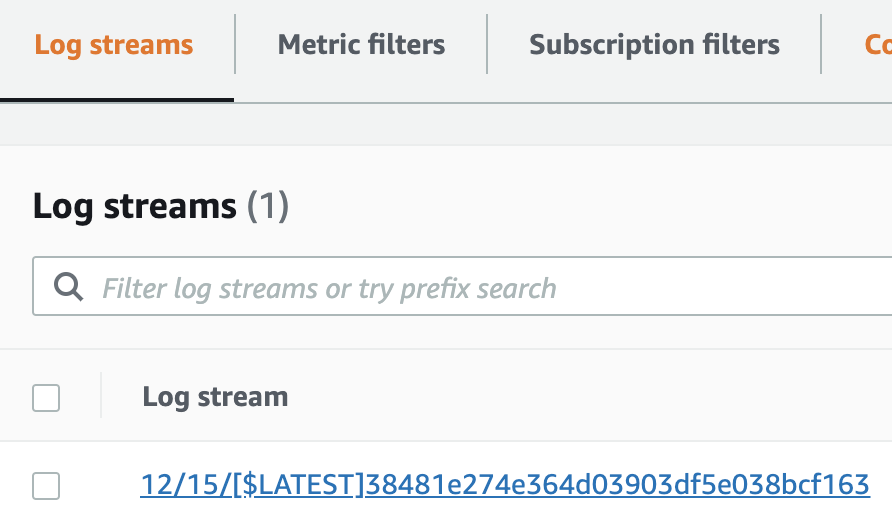
The rows in the table are different Log Streams for the log group.
Each log stream corresponds to log events from the same source. AWS Lambda creates a new log event for every Lambda invocation. However, it is possible to have multiple log streams for a single Lambda function since the log stream corresponds to the container actually running the function.
Behind the scenes, a Lambda is run in a container. After a period of inactivity, the container is unloaded and the following requests will be served by a new container, thus creating a new log stream. Depending on how many times you invoked the test command in the previous step, you will see one or more rows in the log stream.
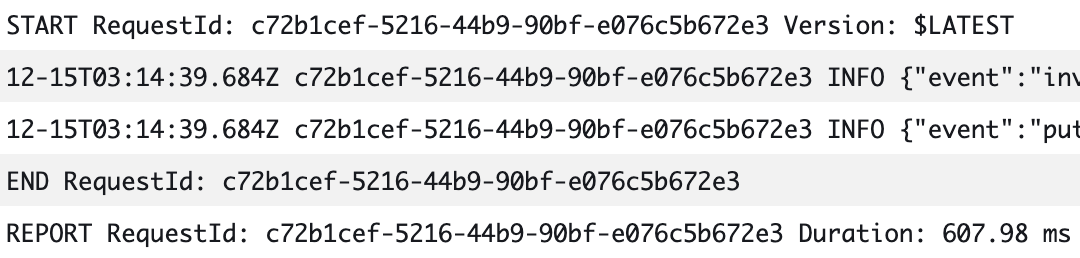
2. Click on the latest Log Stream.
The log stream is a record of event Messages ordered in Time:
3. Enter _PUT_into the Filter eventssearch bar and click enter:
4. Click the triangle to expand the event that matches the filter.
You will see the JSON formatted message:
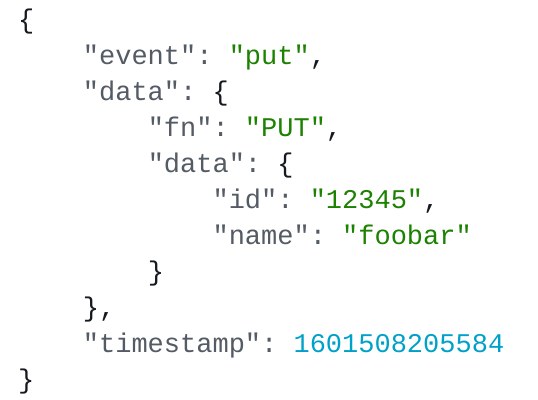
The outermost data attribute wraps the test event you configured.
5. Click custom to display the custom time range filter available in CloudWatch Logs:
Observe the time-based options in the dialog box that displays:
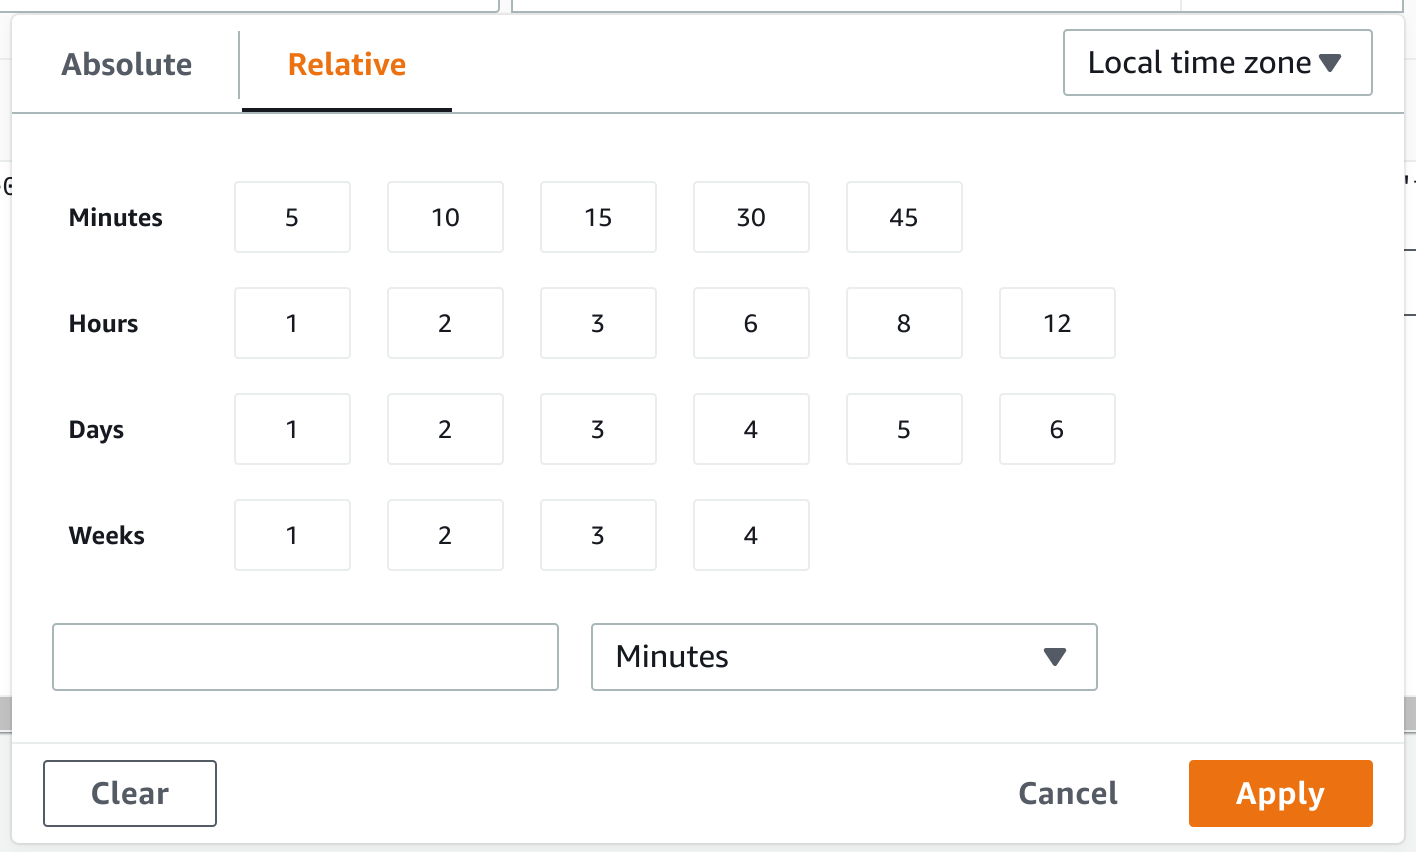
The filter by text and by time capabilities are the tools that are available for sifting through logs in CloudWatch Logs. The text filters support some forms of conditions that can be expressed through a syntax specific to CloudWatch. These capabilities are handy, but you will see that there are more powerful tools available for log aggregation and retrieval.
Launching the OpenSearch Domain
The first thing you need is an Amazon OpenSearch cluster/domain. Using the Amazon OpenSearch Service has the following benefits:
- It’s distributed and resilient
- It supports aggregations
- It supports free-text search
- It’s managed and takes care of most of the operational complexities of operating a cluster
In 2021 AWS renamed Amazon ElasticSearch Service to Amazon OpenSearch Service. You may see references to ElasticSearch in the Amazon Management Console. You should assume that ElasticSearch and OpenSearch refer to the same AWS service.
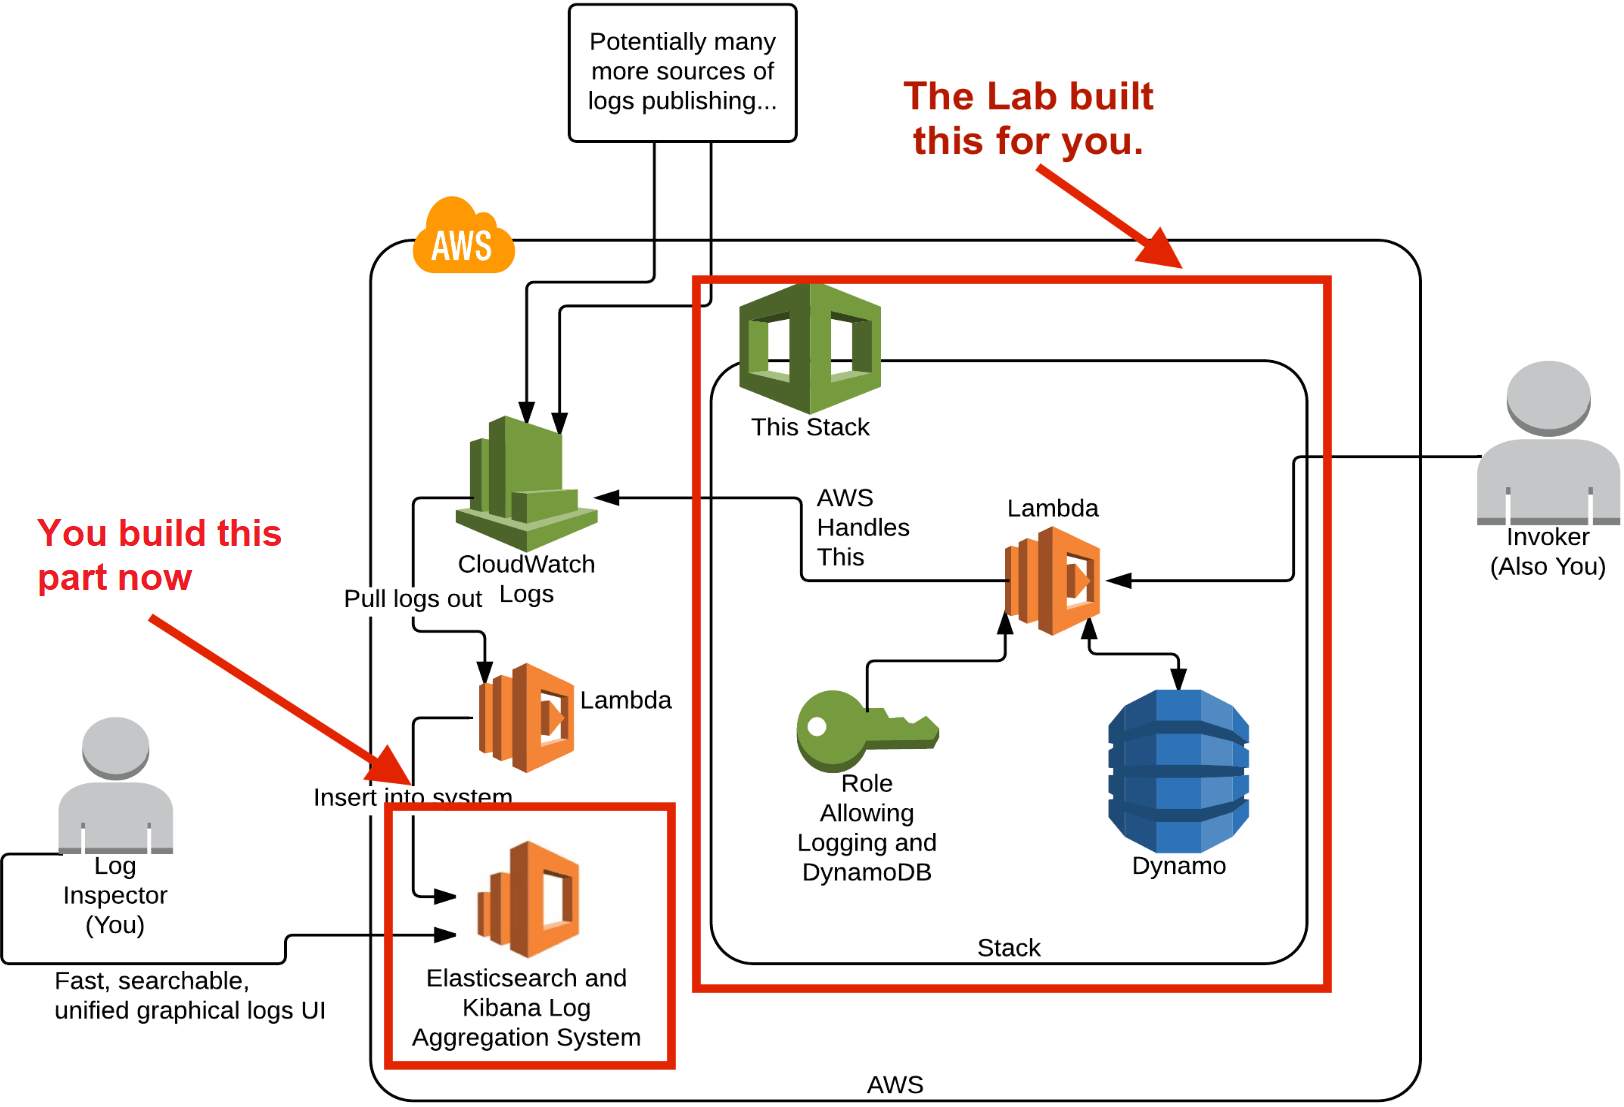
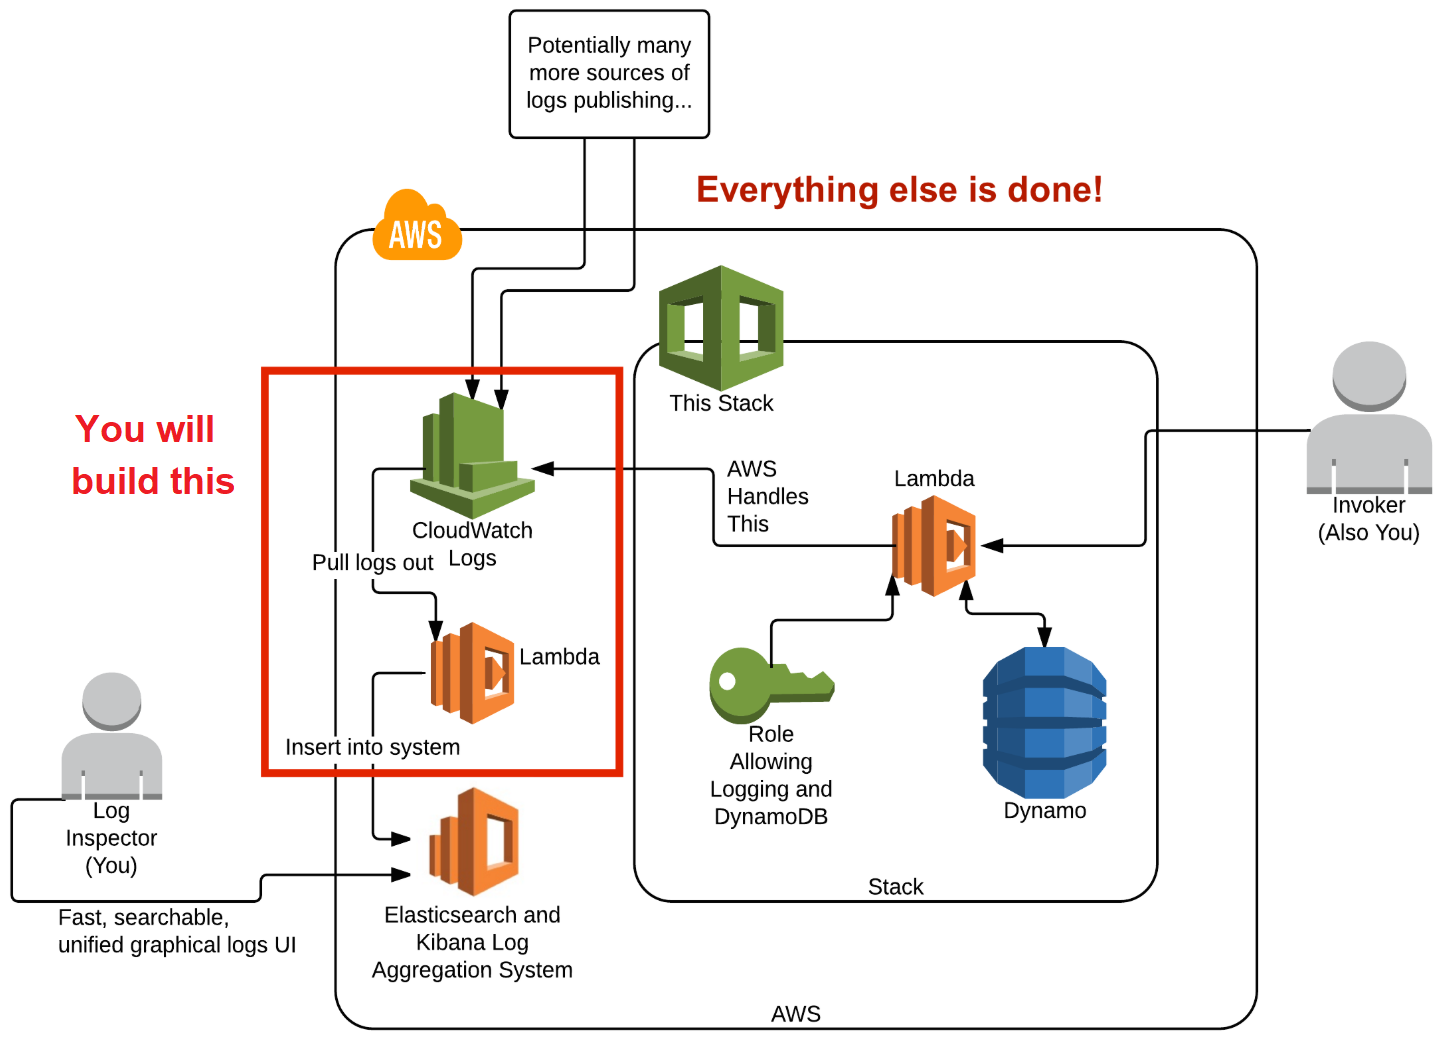
The following diagram illustrates the overall design of the AWS Lab environment and the part that you are building in this lab step is highlighted in the lower-left corner in the AWS cloud:
1. In the search bar at the top, enter OpenSearch, and under Services, click the Amazon OpenSearch Service result:
2. To begin creating your cluster, on the right-hand side of the welcome page, click Create domain:

The terms OpenSearch domain and an OpenSearch cluster can be used almost interchangeably. The former is the logical search resource, and the latter is the actual servers that are launched to create a domain.
The Create domain form will load.
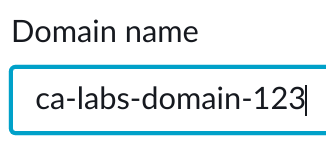
3. In the Name section, in the Domain name textbox, enter ca-labs-domain-###, replacing ### with some random numbers:
4. In the Deployment type section, select the following:
- Deployment type: Select Development and testing
- Version: Select 6.8under ElasticSearch
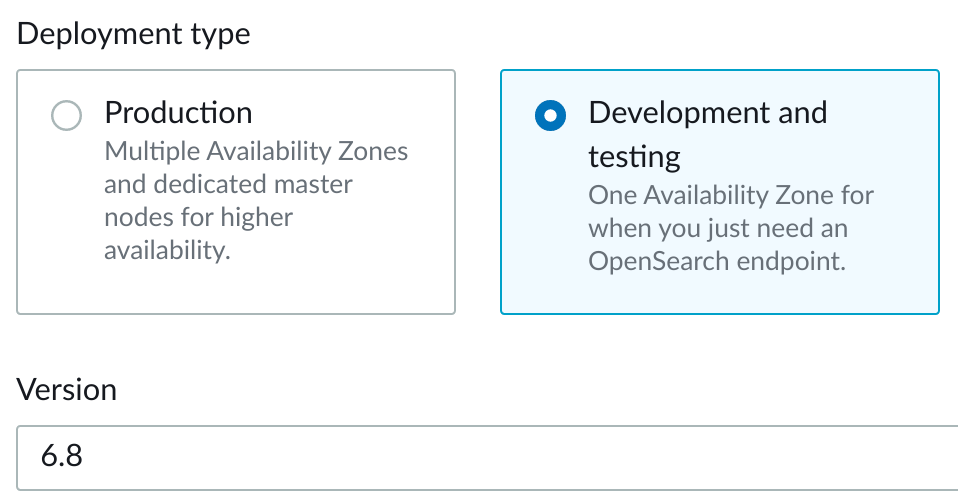
In this short-lived lab, you are using a Development and testing deployment because it allows public access and reliability isn’t a concern. In a production environment, you will want to use a Production deployment to get the full availability benefits and meet security requirements.
5. In the Auto-Tune section, select Disable.
In this short-lived lab, Auto-Tune is not necessary.
6. In the Data nodes section, enter and select the following and leave remaining defaults:
- Instance type: Select t3.small.search
- Number of nodes: Enter 1
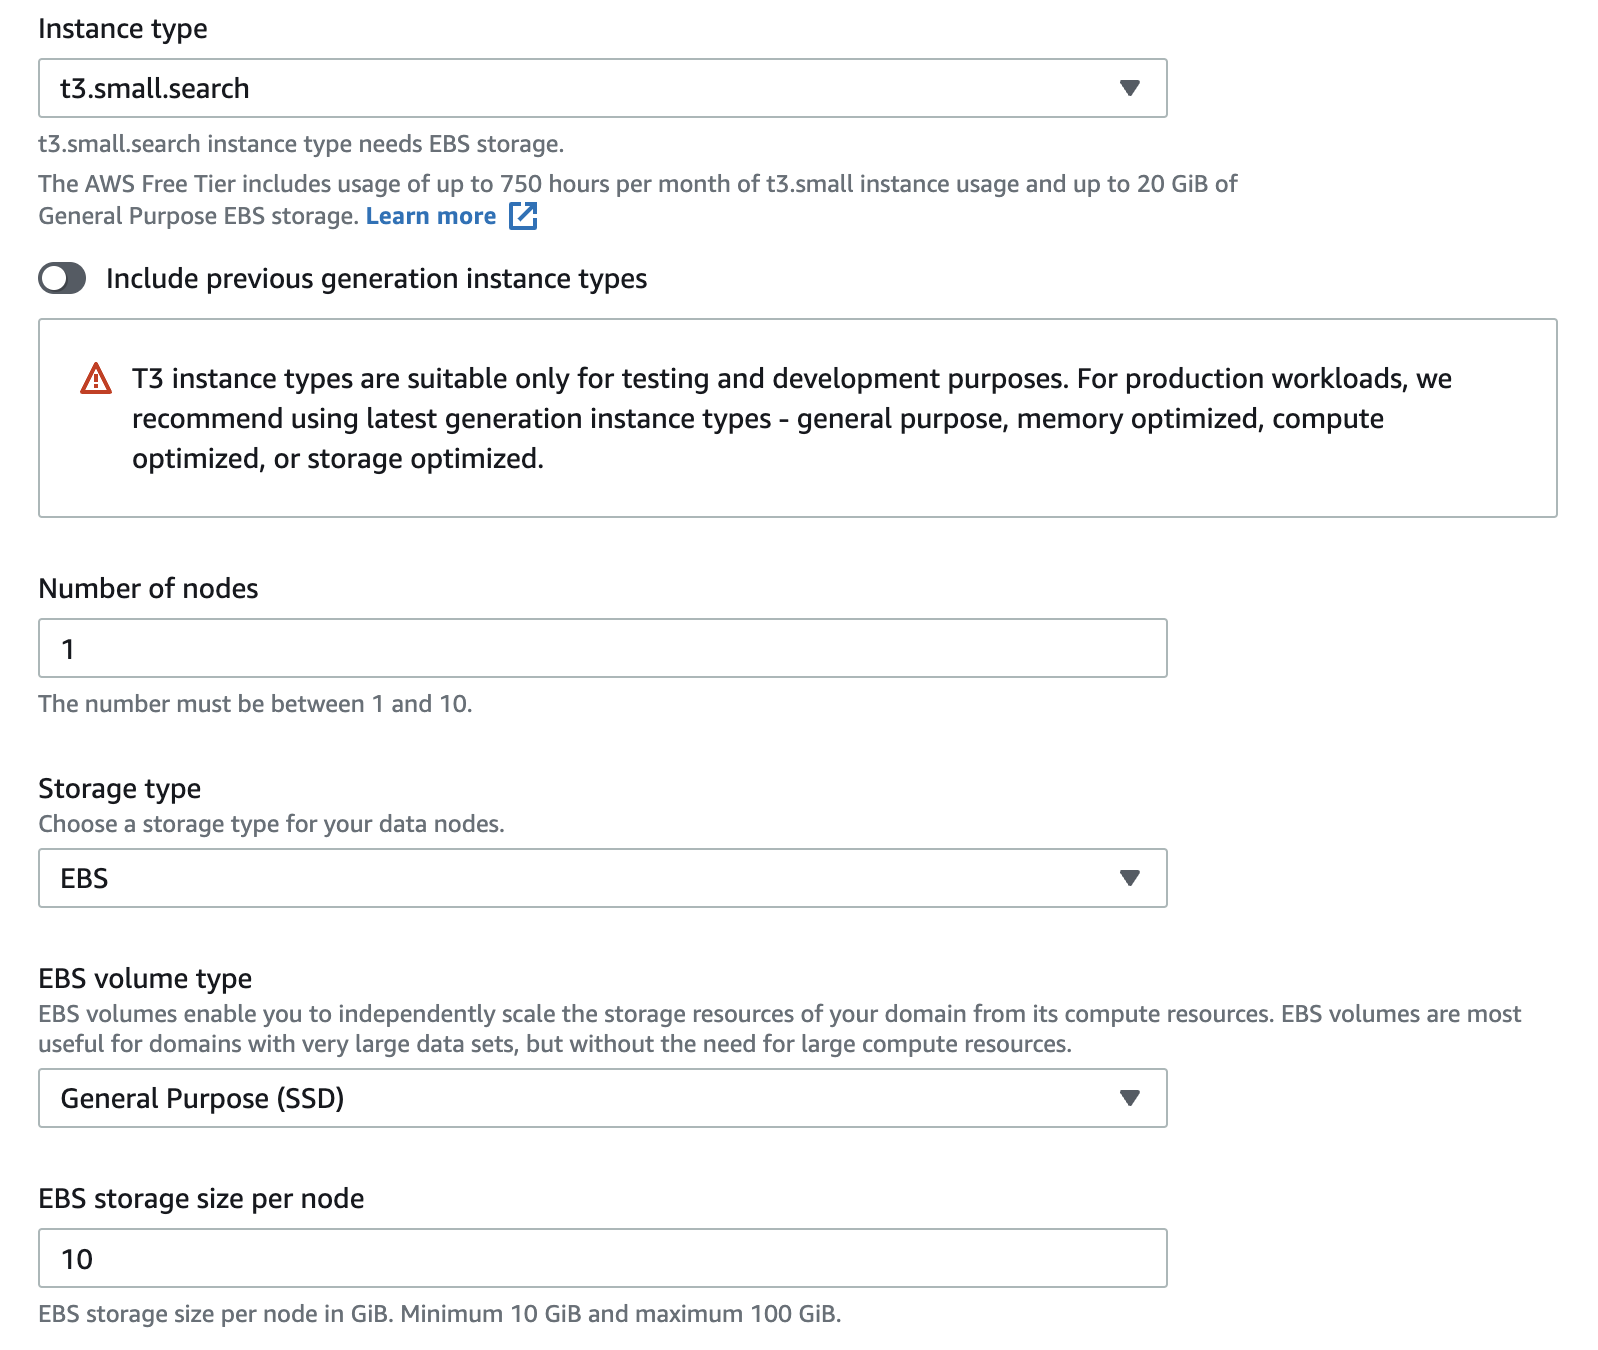
The storage type values correspond to the storage types available for Amazon EC2 instances.
When deploying a cluster that uses multiple nodes, you can specify that the nodes are deployed in two or three availability zones. Deploying in multiple availability zones makes the cluster highly available and more reliable in the case of failures of outages.
7. Scroll down to the Network section, and select Public access:
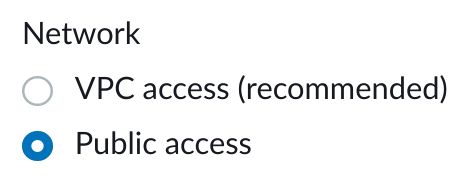
In this lab, you are creating a publicly available Amazon OpenSearch Service cluster for convenience. Be aware that you can also deploy a cluster into an Amazon Virtual Private Cloud (VPC) and receive the network isolation and security advantages of using a VPC.
8. In the Fine-grained access controlsection, uncheck the Enable fine-grained access controlbox.
9. In a new browser tab, enter the following URL:
https://checkip.amazonaws.com/
You will see an IP address displayed. This is the public IPv4 address of your internet connection. You will use this IP address to restrict access to your Amazon OpenSearch Service cluster.
10. Scroll down to the Access Policy section and under Domain access policy, select Configure domain level access policy:

You will see a policy editor form display with the tabs Visual editor and JSON.
11. In the Visual editor tab, enter and select the following:
- Type: Select IPv4 address
- Principal: Enter the IP address you saw on the Check IP Page
- Action: Select Allow

You are specifying an access policy that allows access to the cluster from your IP address. In a non-lab environment, you could deploy the cluster into an Amazon VPC and configure private or public access using a VPC’s networking features.
12. To finish creating your cluster, scroll to the bottom and click Create:

A page displaying details of your cluster will load and you will see a green notification that you have successfully created a cluster.
13. In the General information section, observe the Domain status:
AWS is setting up and deploying your cluster. This process can take up to 15 or 30 minutes to complete.
12. To see the latest status of your Amazon OpenSearch Service cluster, refresh the page in your browser.
Refresh the page for your domain periodically to check if it has finished deploying.
Whilst waiting for the domain to finish provisioning, feel free to consult the Amazon OpenSearch Service Developer Guide to learn more about the OpenSearch service.
When the cluster has been provisioned you will see the Domain status change to Active:
Sending CloudWatch Logs to OpenSearch
1. In the AWS Management Console search bar, enter CloudWatch, and click the CloudWatch result under Services:
2. In the left-hand menu, under Logs, click on Log groups:
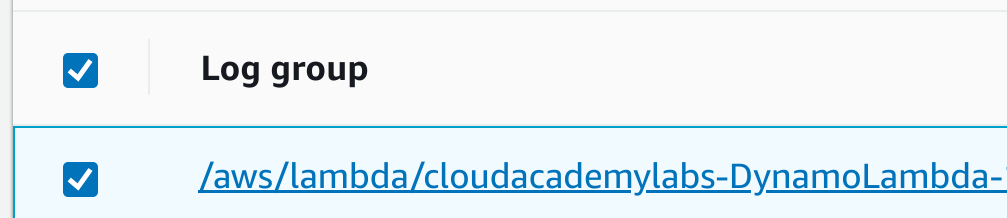
3. Select the log group beginning with /aws/lambda/cloudacademylabs-DynamoLambda-:
Next, you will create a subscription filter to send the log data to your ElasticSearch domain.
4. Click Actions, in the menu that opens, under Subscription filters, click Create Amazon OpenSearch Service subscription filter:

The Create Amazon OpenSearch Service subscription filter form will load.
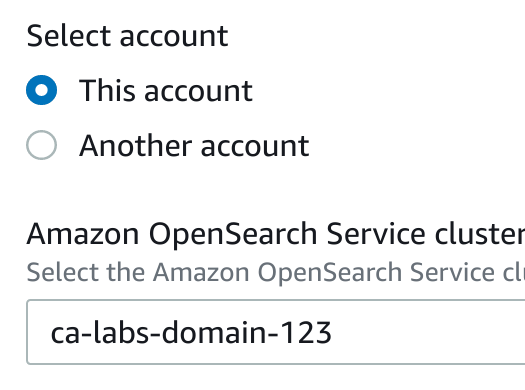
5. In the Choose destination section, select the following:
- Select account: Ensure This accountis selected
- Amazon OpenSearch Service cluster: Select the cluster you created previously
After selecting the Amazon OpenSearchService cluster, the Lambda function section will appear.
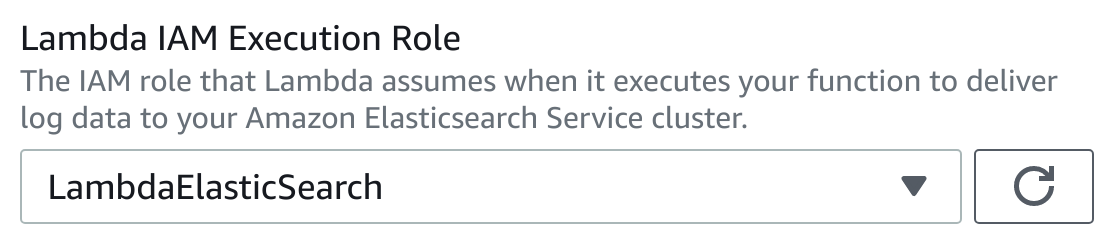
6. In the Lambda IAM Execution Role drop-down select LambdaElasticSearch:
7. In the Configure log format and filters section enter the following:
- Log Format: Select Amazon Lambda
- Subscription filter name: ca-lab-filter
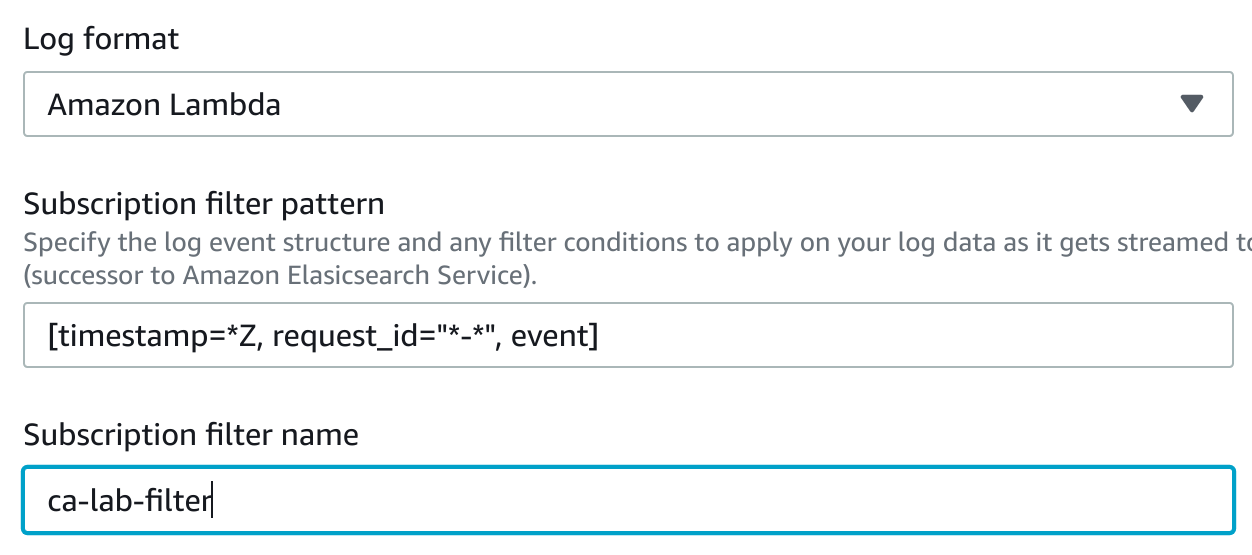
The default Subscription Filter Pattern matches the timestamp, request_id, and event JSON. The Test Patternbutton is available to see which events match the pattern.
8. To start sending the logs to ElasticSearch, at the bottom, click Start streaming:
Momentarily, you will see a notification that the subscription filter has been created and logs are being streamed to OpenSearch:

Discovering and Searching Events
1. Navigate back to the Lambda function you invoked earlier and click the Test button a few times to submit more PUT events:
2. Click the arrow on the Test button and click Configure test event:
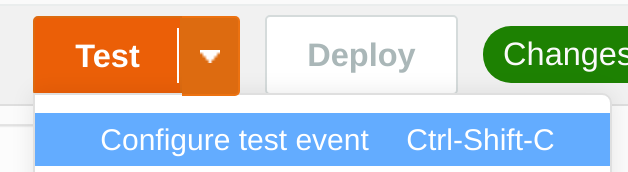
3. In the Configure test eventsform, click the radio button for Create new test event and enter the following non-default values:
- Event name:TestGetEvent
- Enter the following in the code editor at the bottom of the form:
{
"fn": "GET",
"id": "12345"
}
You will submit more test events of a different type - GET operations on the object that was PUT in the database. This gives two different event types to look at in Kibana (the Log Aggregation UI).
4. Click Save.
5. Click Test several times to make GET events.
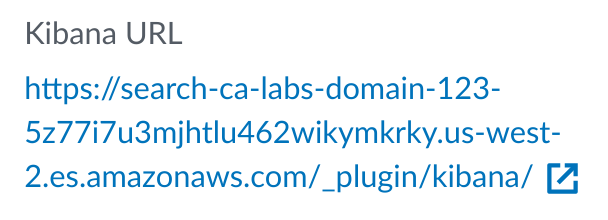
6. Return to the Amazon OpenSearch Search Console for the domain you created and click the link under Kibana URL:
7. In the Add Data to Kibana section, on the right-hand side under Use Elasticsearch data, click Connect to your Elasticsearch index:

The log data is stored in OpenSearch, but you need to tell Kibana which index to use for discovering the data.
8. In the Create an index patternwizard, enter the following value and click Next step:
- Index pattern: cwl-*
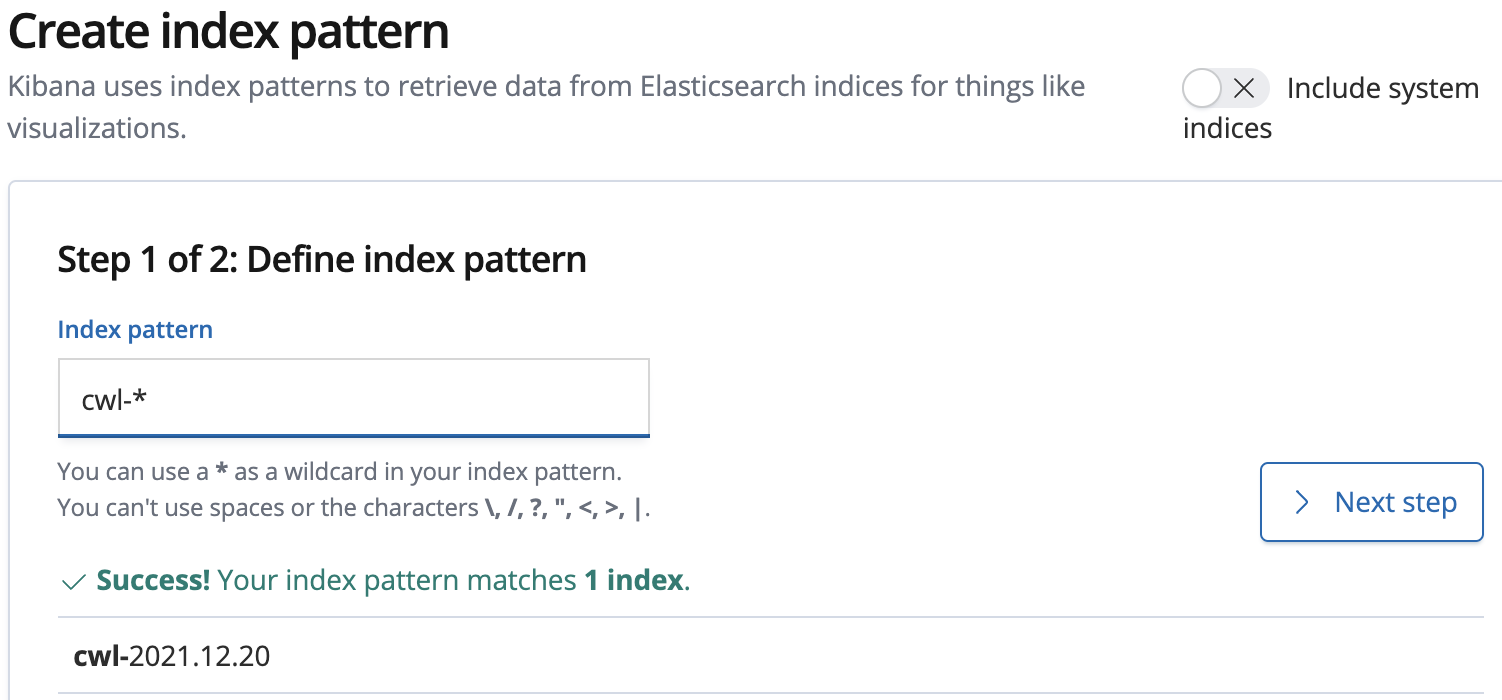
The pattern will match the daily CloudWatch Logs (cwl) indices that are created in Amazon OpenSearch.
9. In the second step, enter the following value and click Create index pattern:
- Index pattern: Select @timestamp
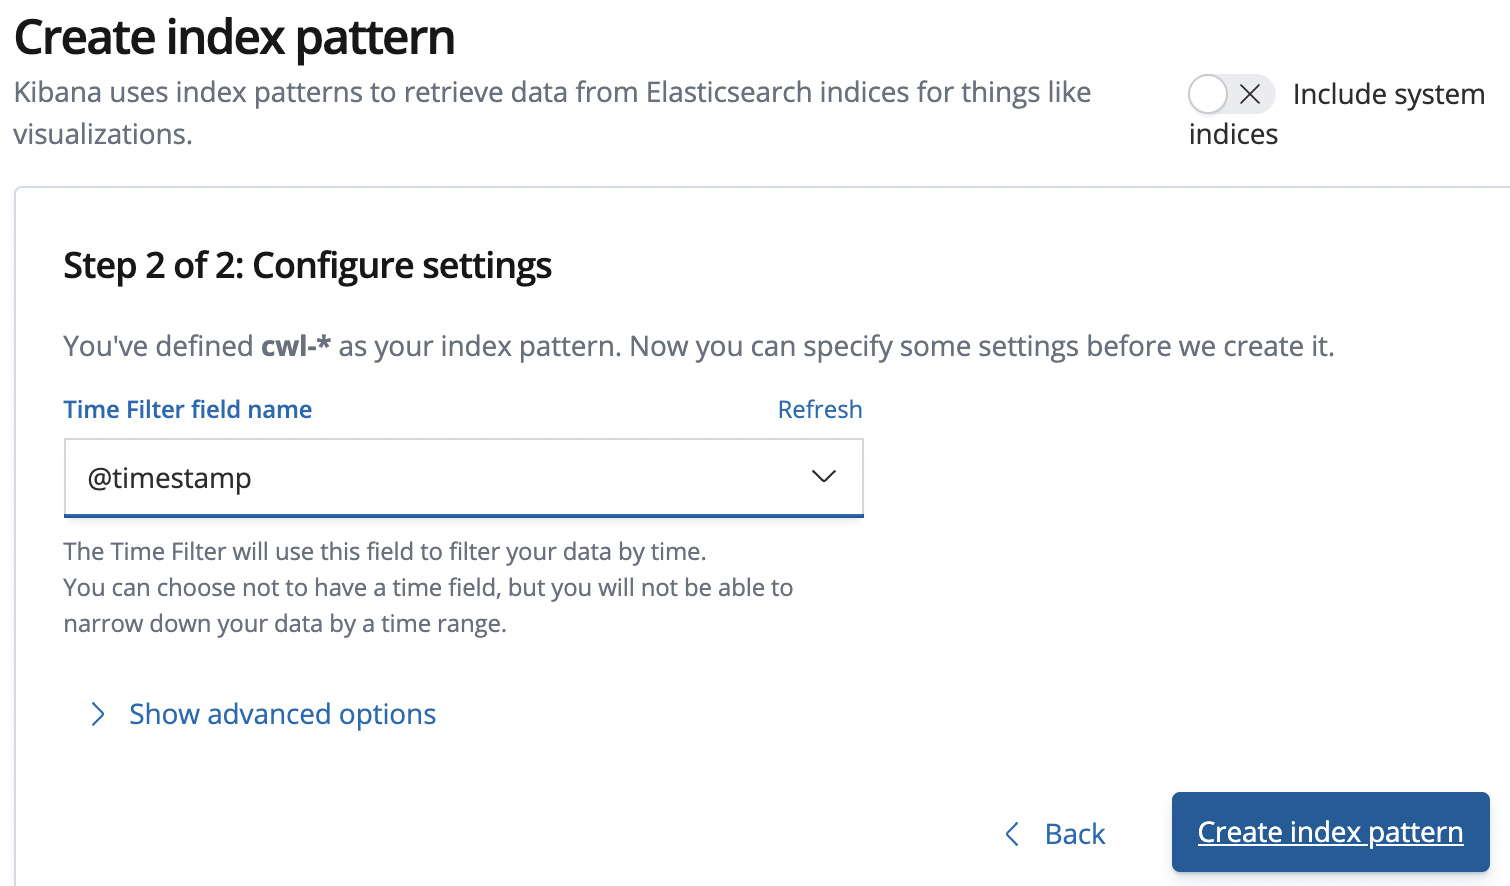
The Time filter field name allows Kibana to determine which attribute represents the timestamp of each event. The confirmation page displays all of the fields in the log data index:
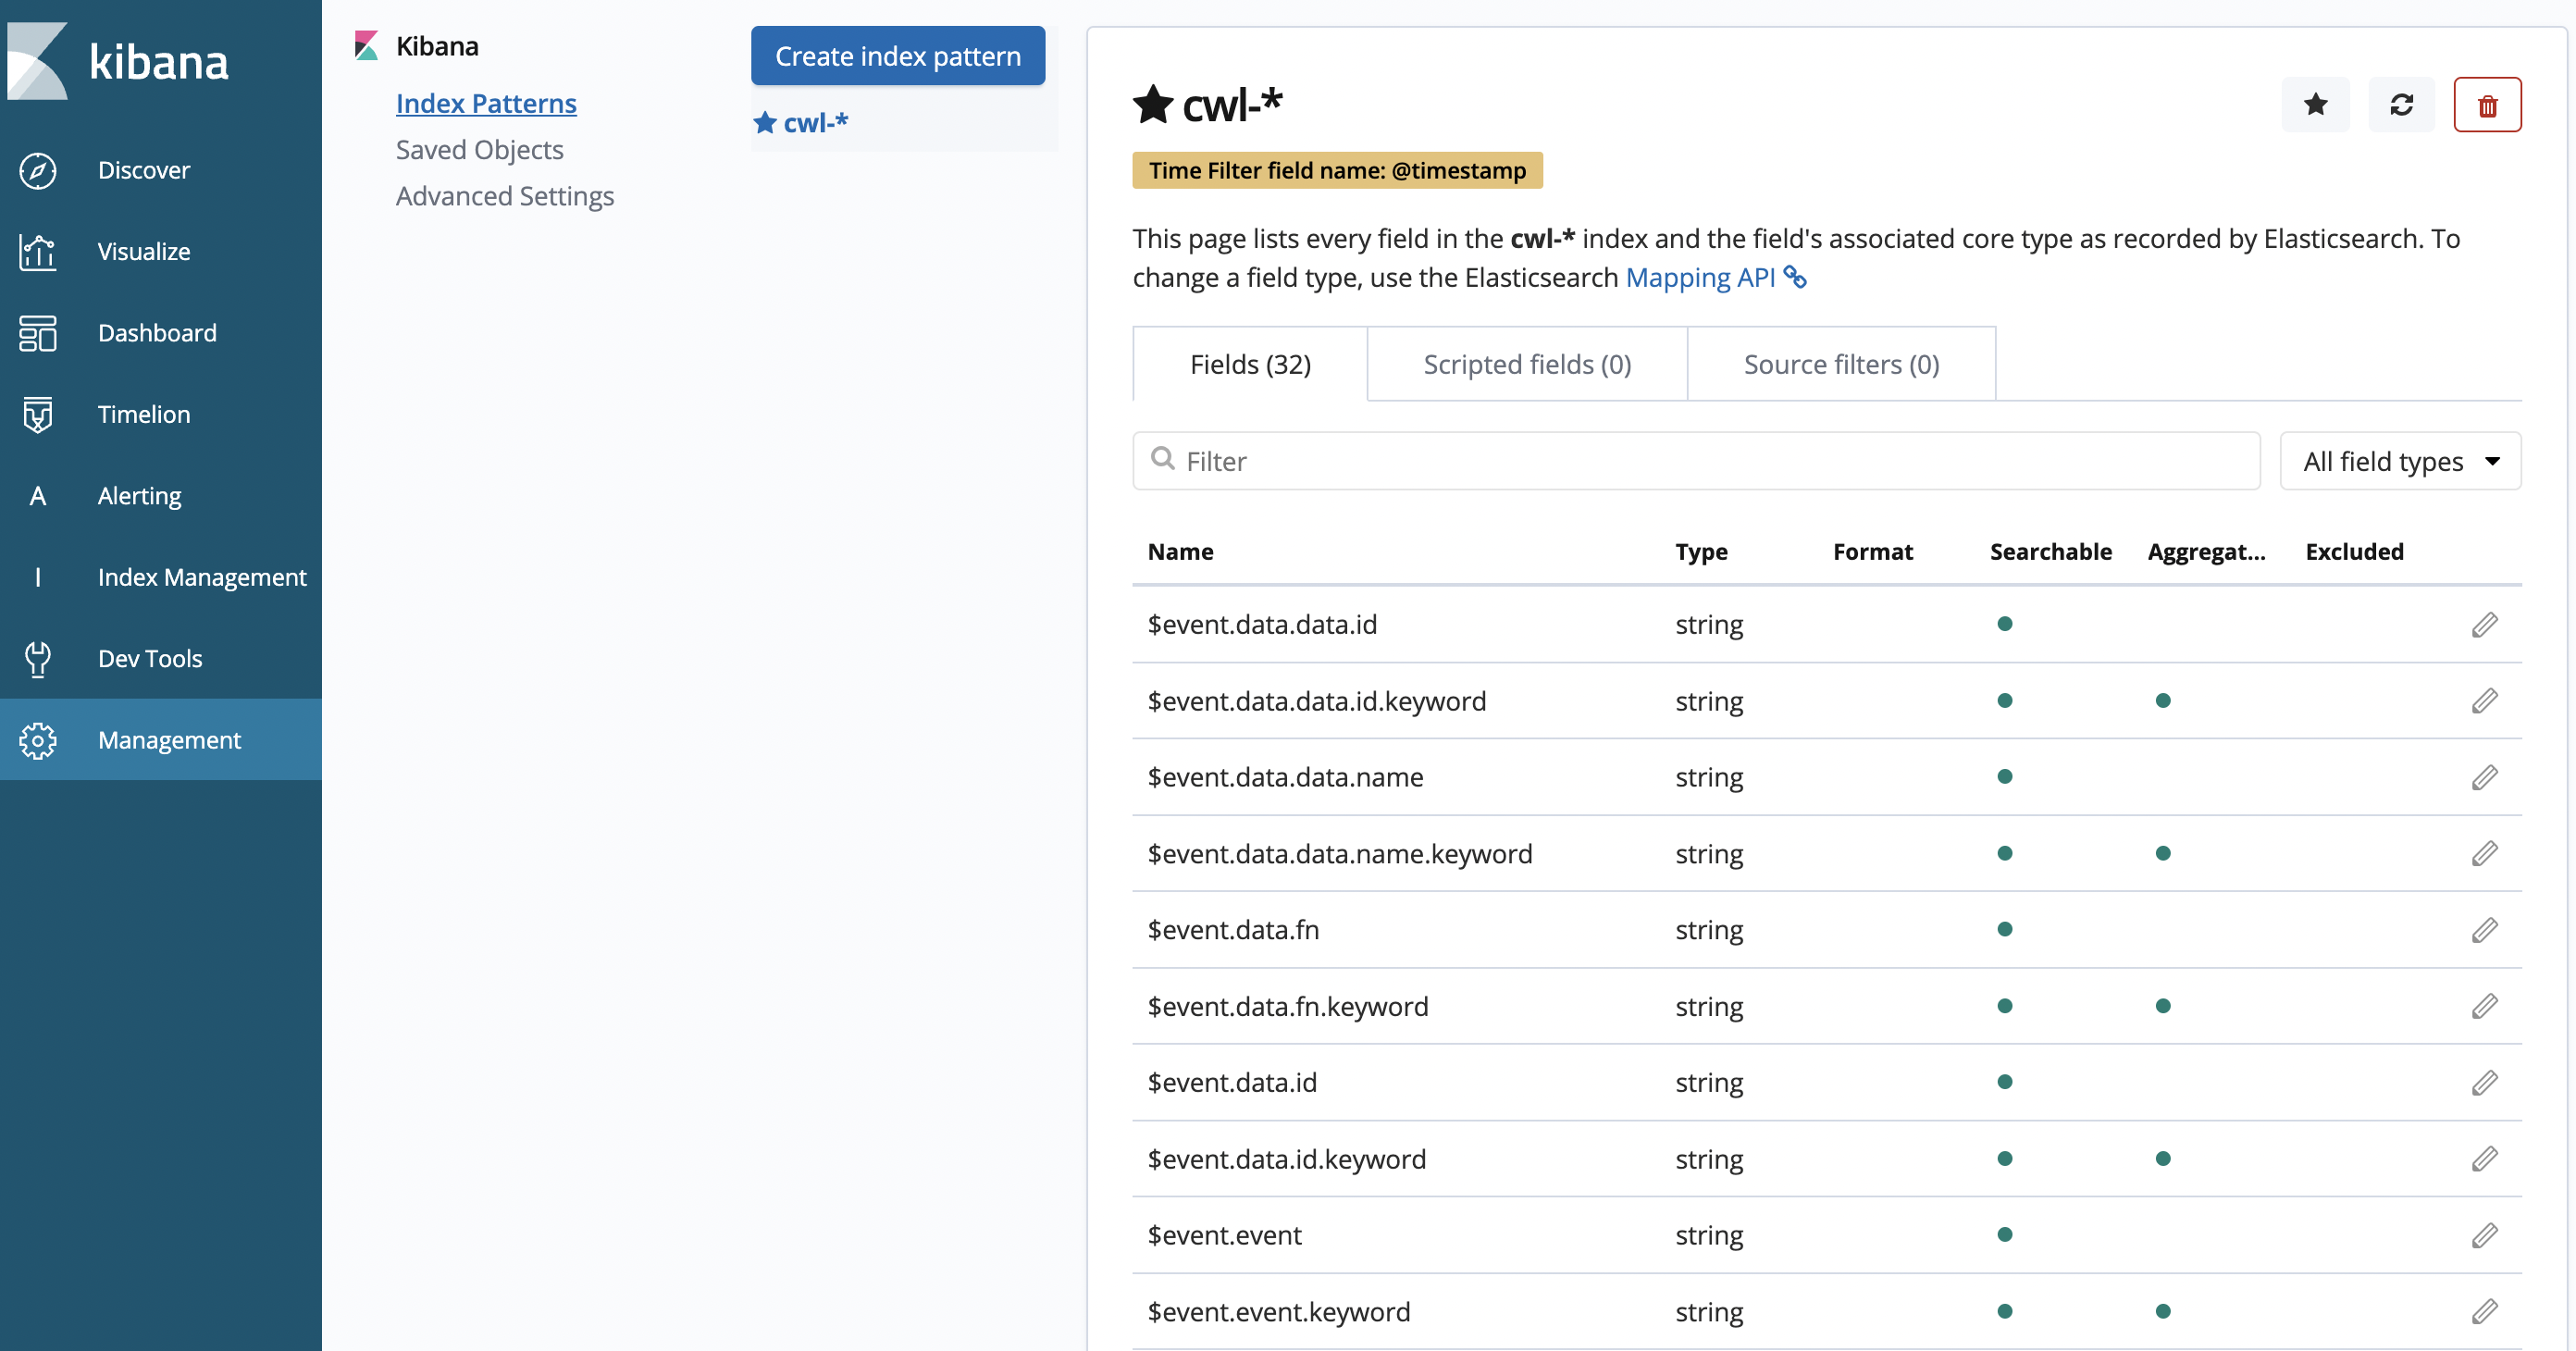
Now that the index settings for Kibana are configured, you can begin using the Log Aggregation system!
10. Click Discover in the sidebar menu on the left of the page.
11. Explore the Discover interface:
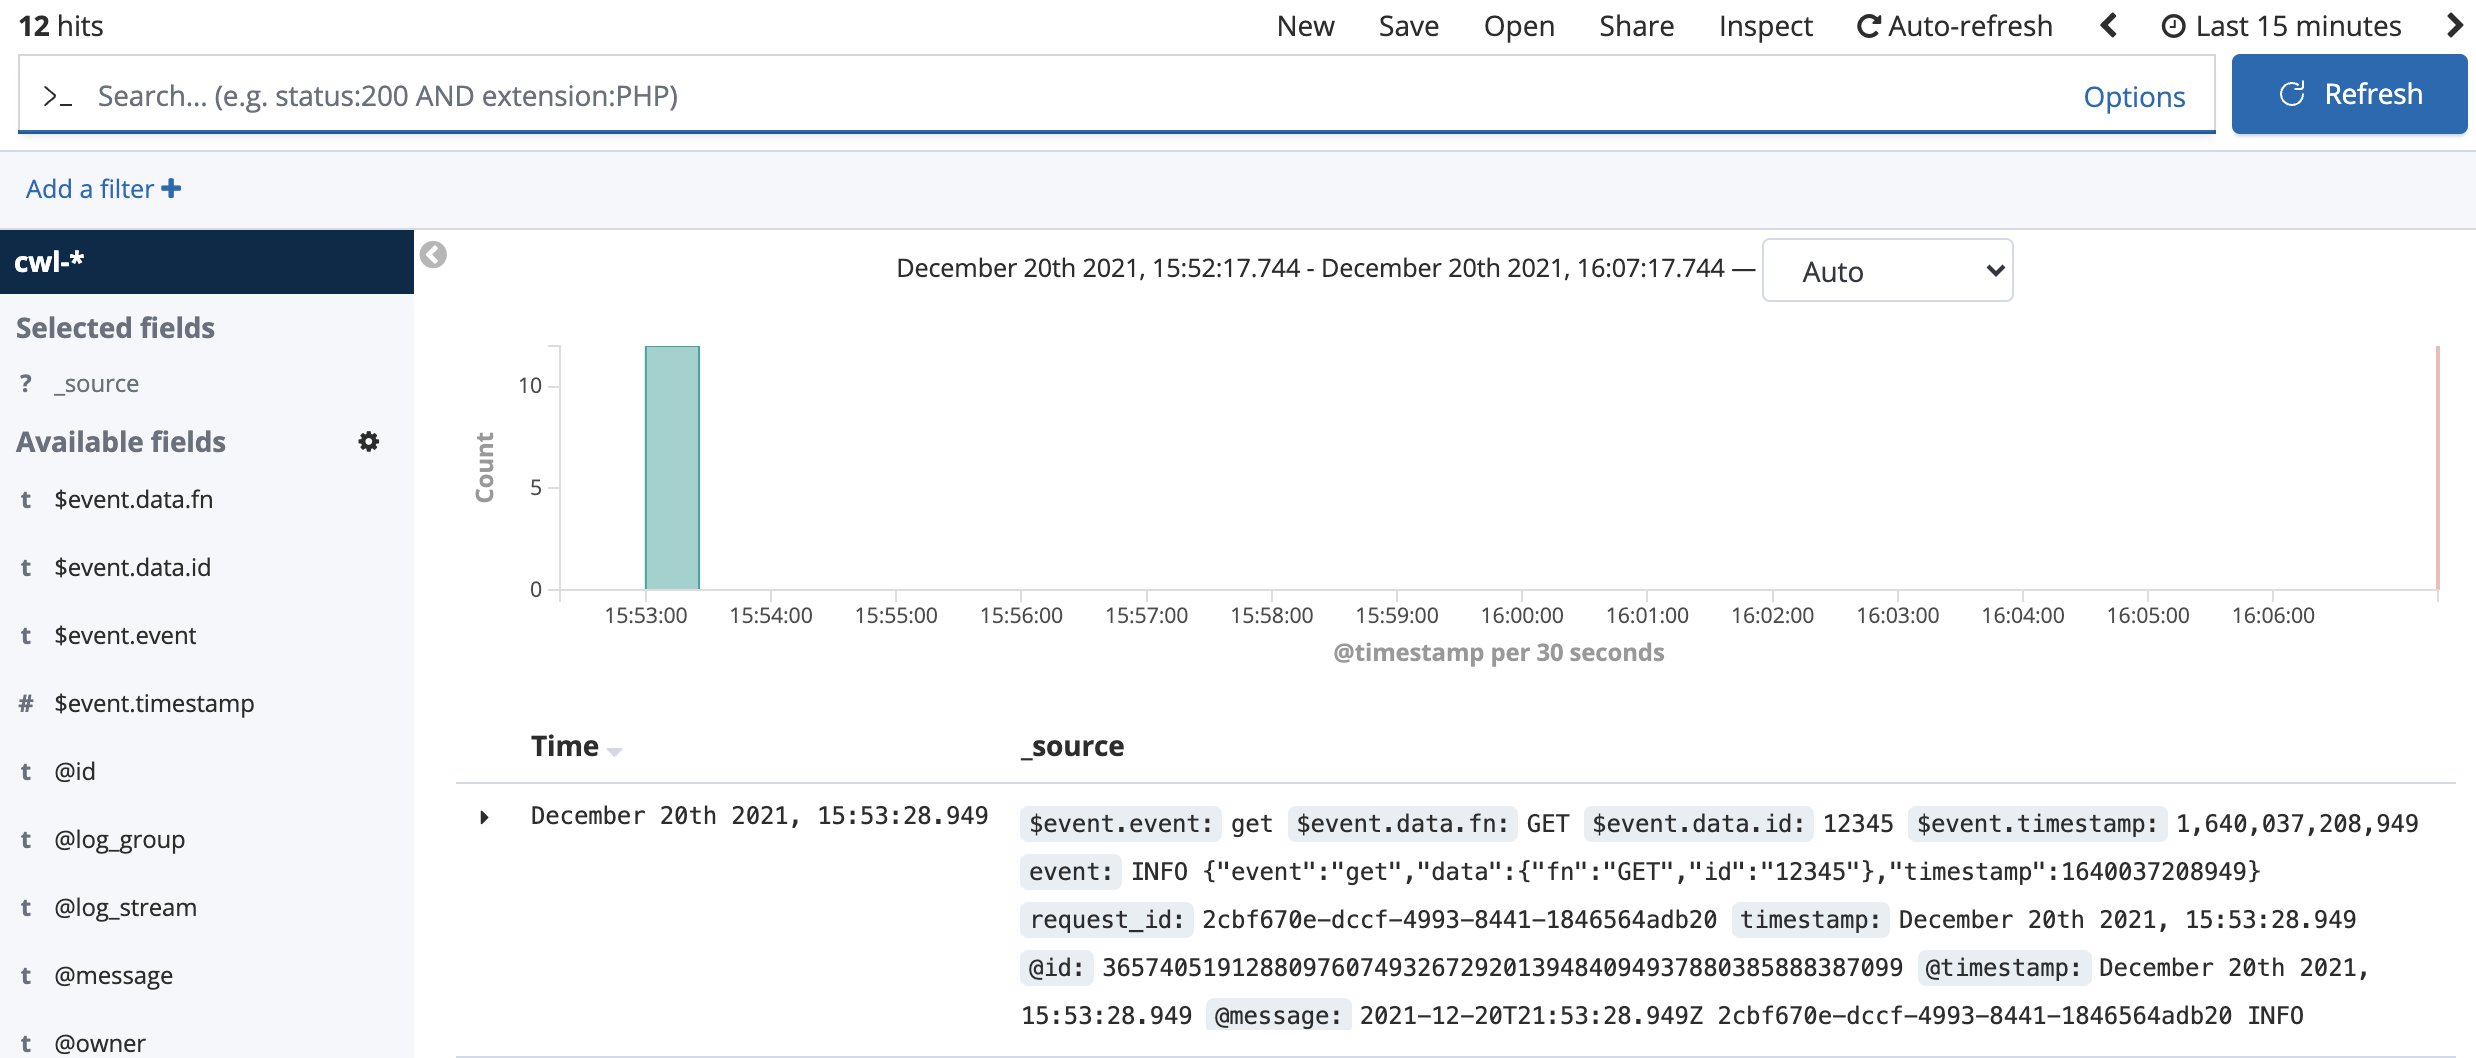
You see some events and a graph. These are your aggregated log events! The system is online! Notice the search bar up top. It is initially empty so all log events will show up. But what if you only want to see the PUT events for objects containing 12345?
12. Enter PUT 12345 in the search bar and press enter:
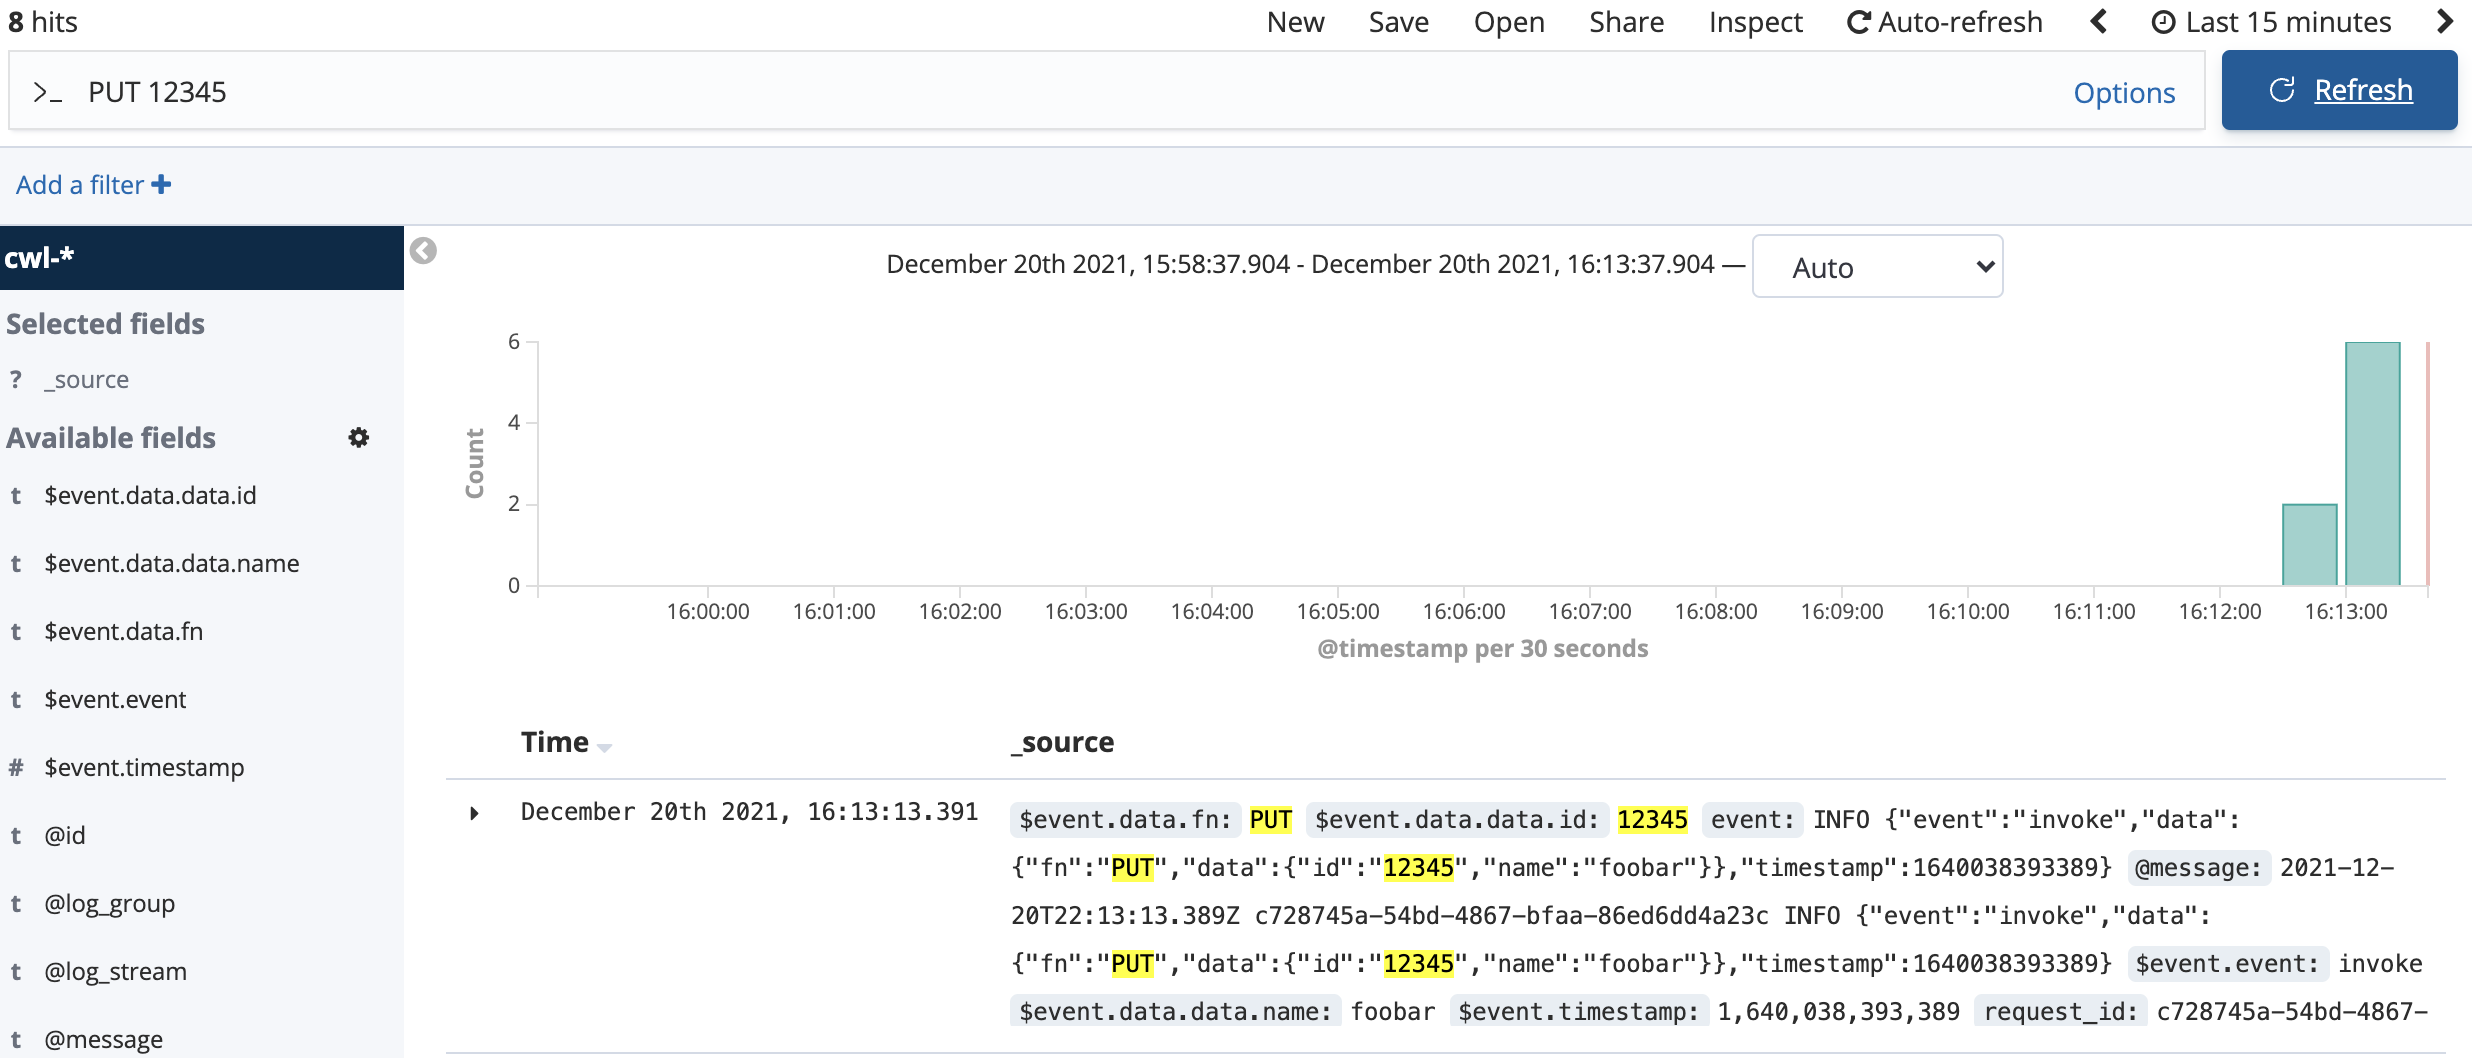
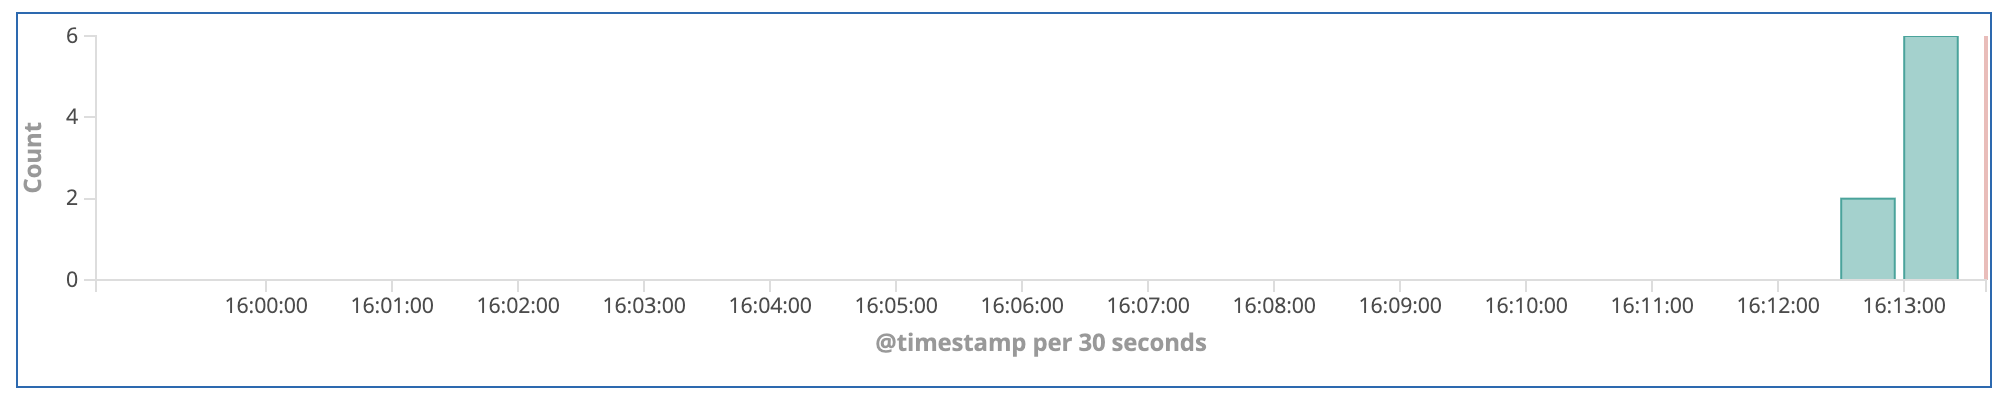
The matching terms in the event show up highlighted, and the bar graph updates to show only the count of PUT 12345 events that you made by clicking Test in the Lambda interface.
13. Click on the timestamp range in the upper-right corner to display the time filter:
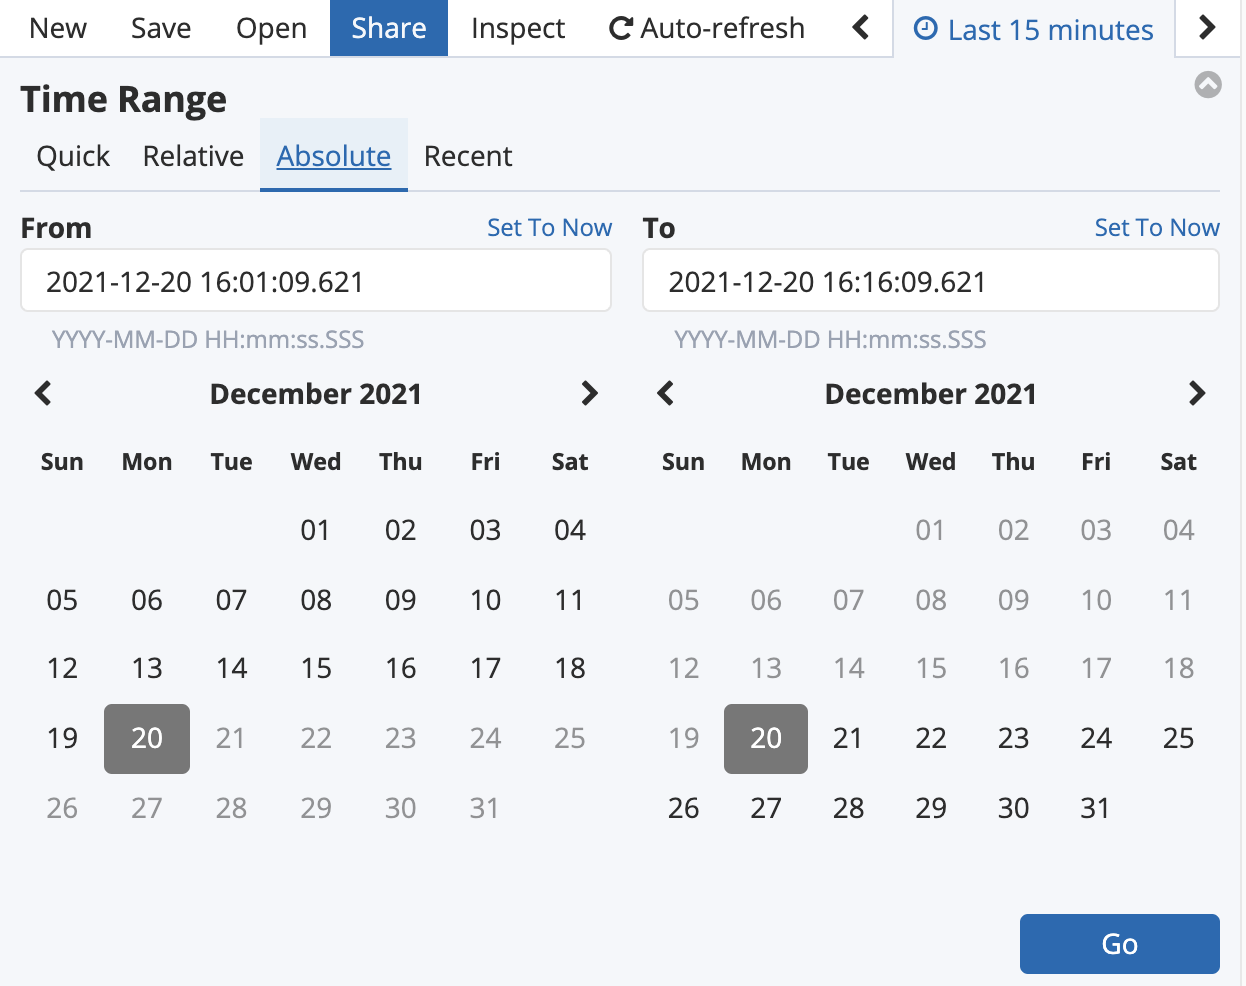
Just as with CloudWatch Logs, you can filter the logs by time. However, in Kibana you can also drag on the bar chart to select a time range visually:
Visualizing Aggregated Events
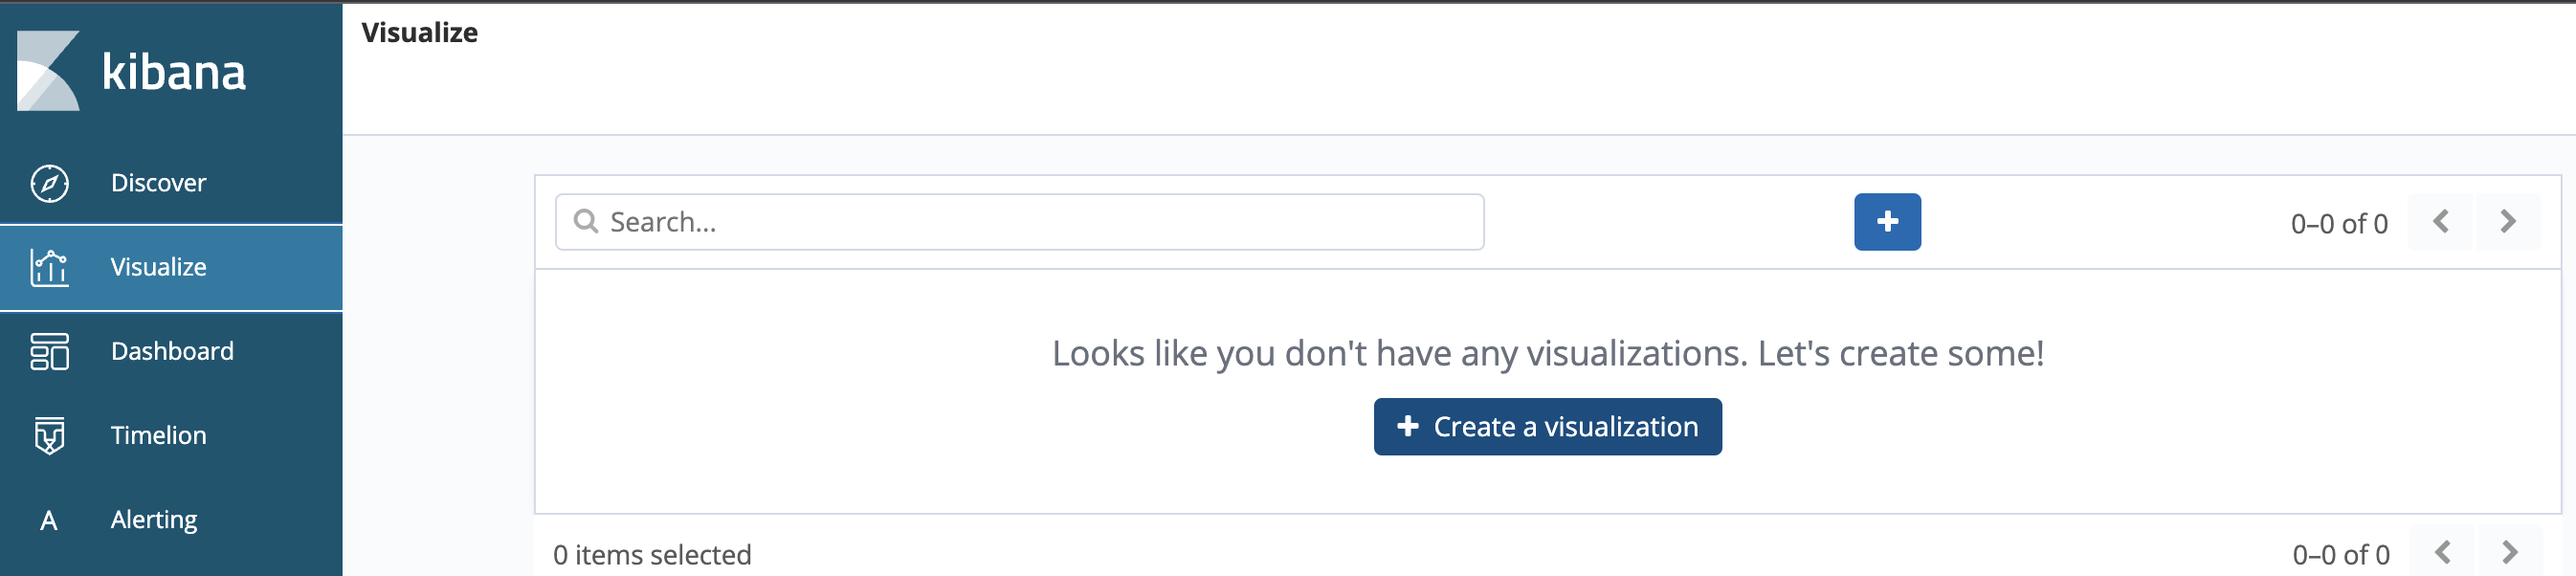
1. Click Visualize in the Kibana sidebar menu.
2. Click Create a visualization:
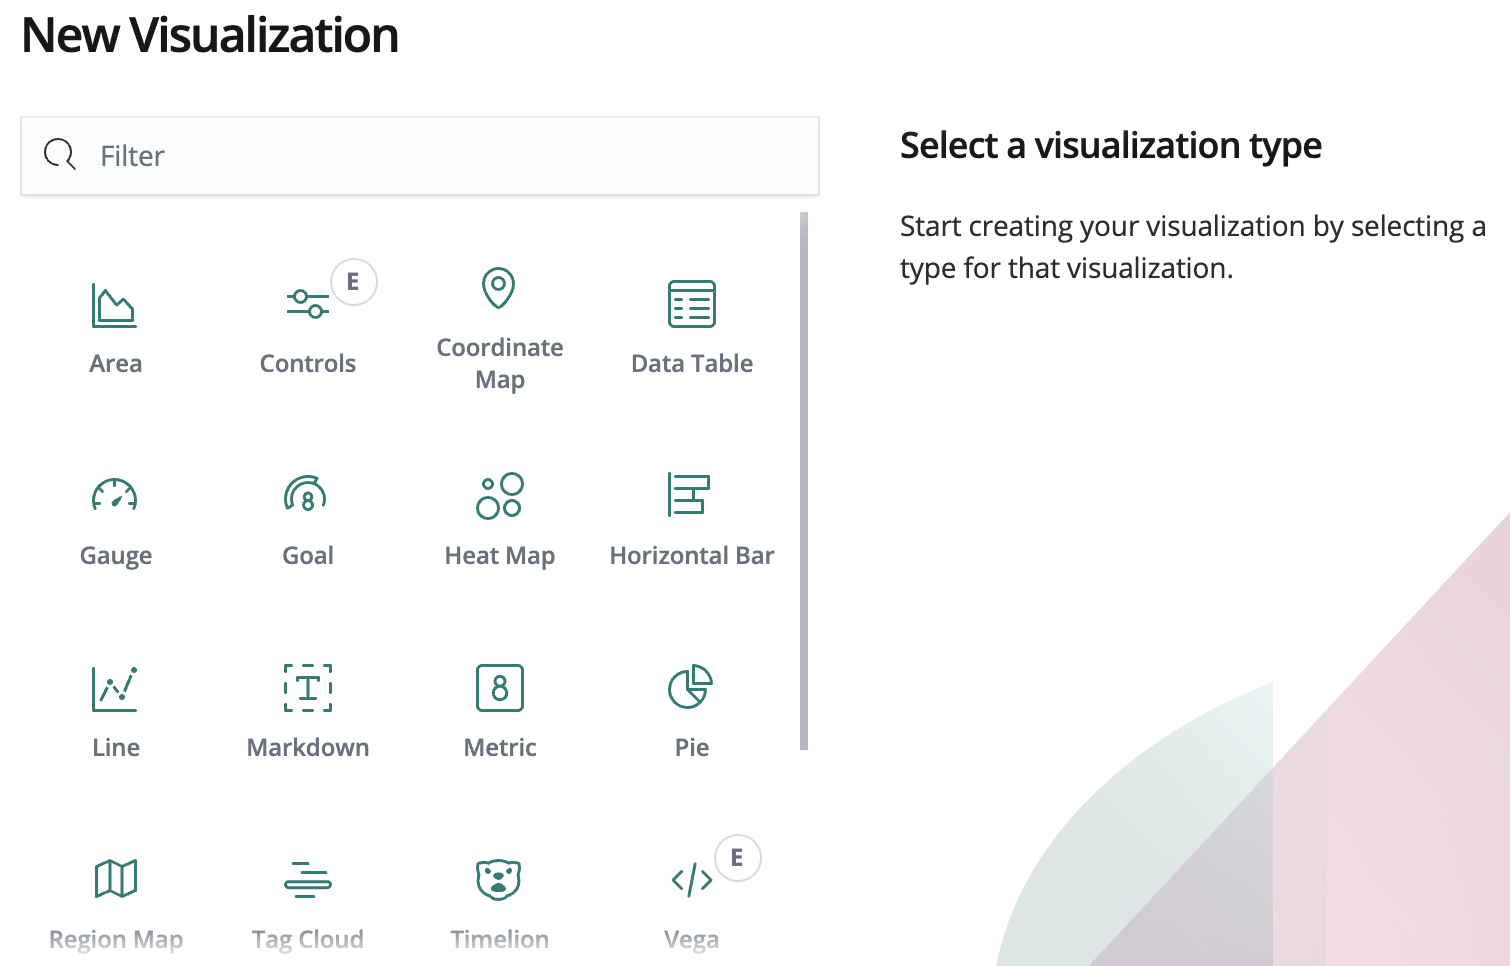
3. Select Areachart visualization:
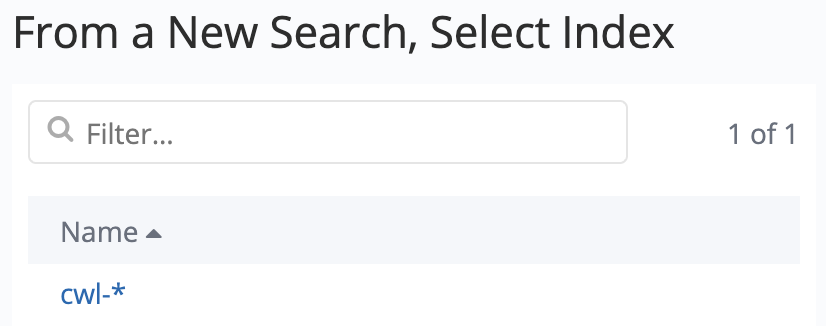
4. In the From a New Search, Select Indexarea, click on the *cwl- **index name:
If you had any saved searches in the system, you could use them to make this Visualization from this step.
On the left-hand side, the visualization configuration tools will appear:
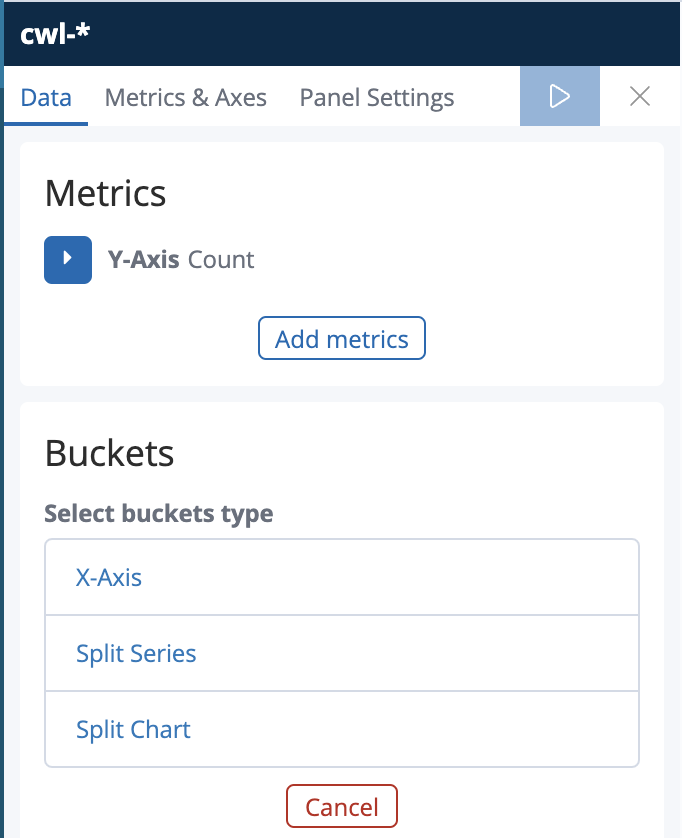
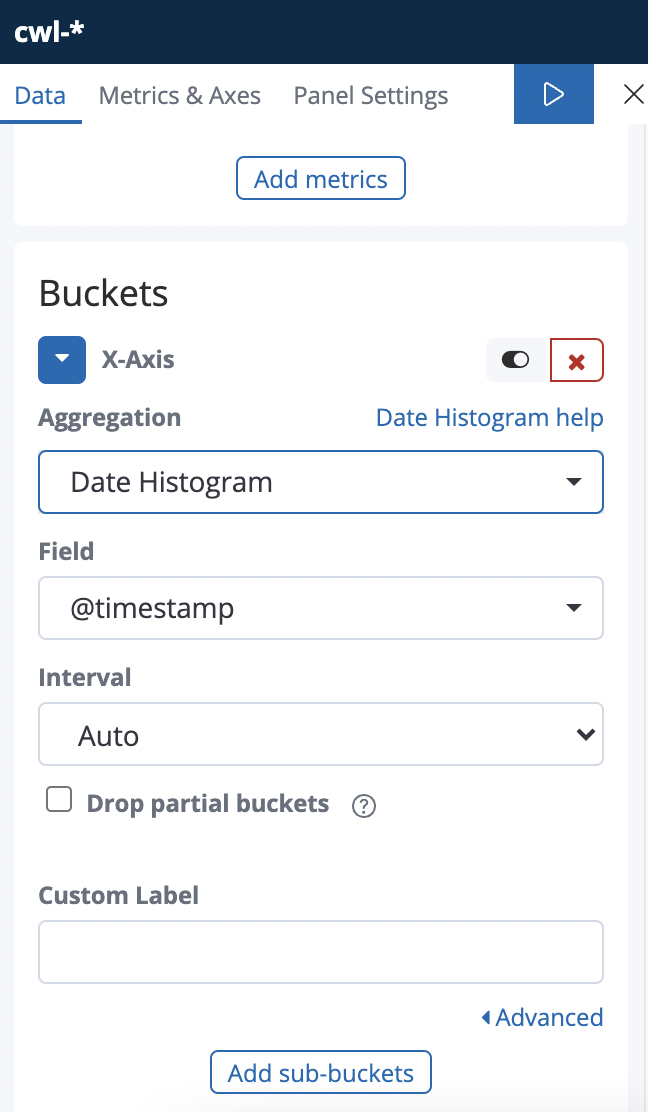
5. Enter the following values in the visualization configuration:
- Select buckets type: X-Axis
- Aggregation: Date Histogram (to track log trends over time)
- Field: @timestamp
- Interval: Auto
To make the graph more interesting, you will split the PUTs and GETs and display each stacked in on the chart with different colors. This requires a sub-buckets.
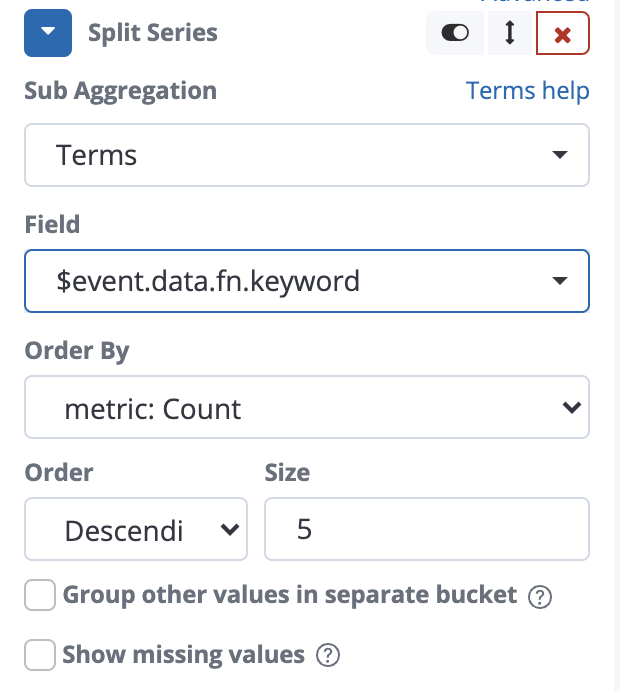
6. Click Add sub-buckets below the rest of the X-Axis settings, and enter the following values:
- Select buckets type: Split Series
- Sub Aggregation: Terms (Terms splits the data based on the unique values of a field)
- Field: $event.data.fn.keyword (The test requests used the
fnkey for request type, which maps to the$event.data.fn.keywordfield in OpenSearch)
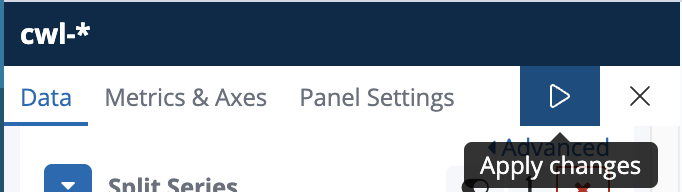
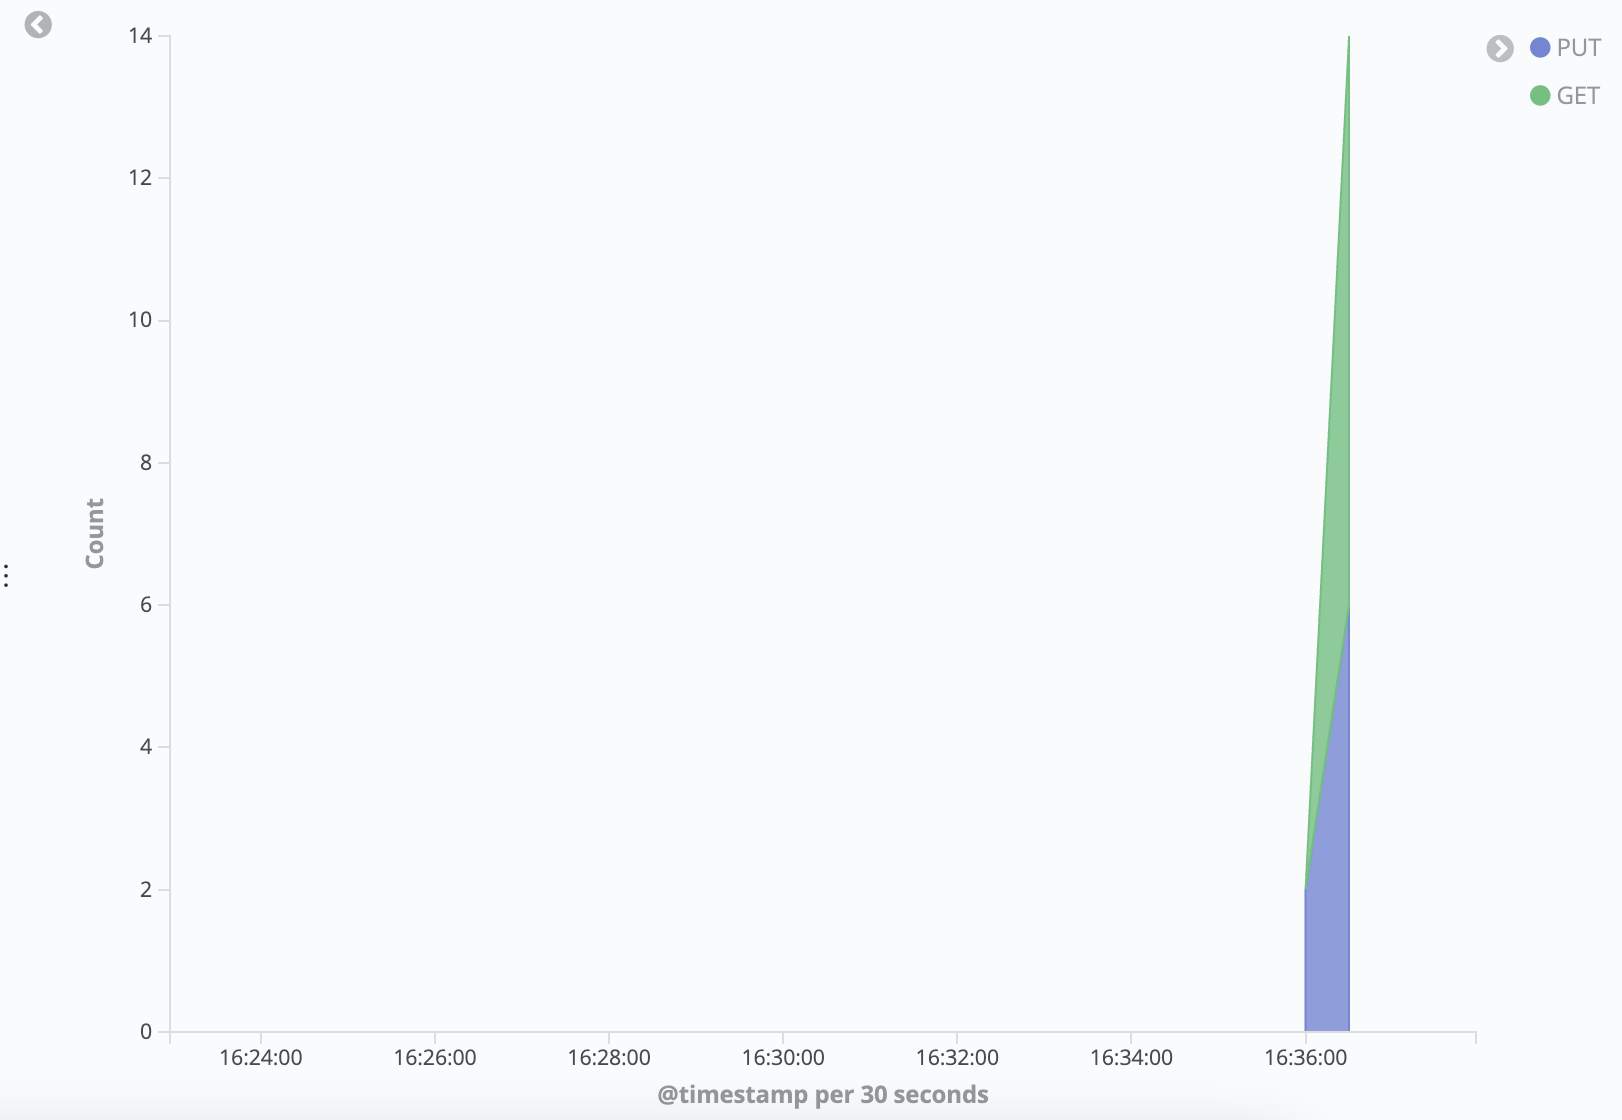
7. Click the play button to apply the changes and produce the visualization:
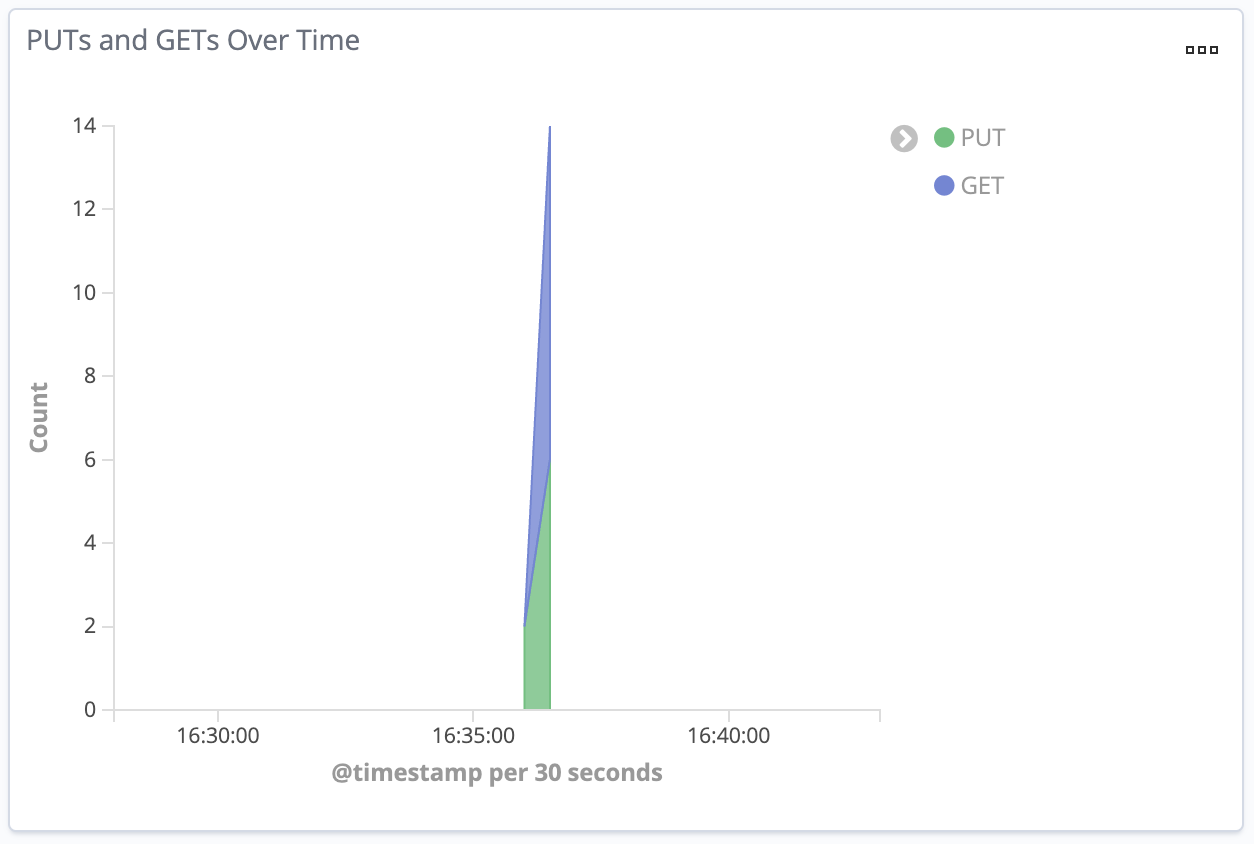
It will look something like the image below, with two regions in an area graph corresponding to GET and PUT event count over time:
To use the visualization in a Dashboard in the next step, you need to save the visualization.
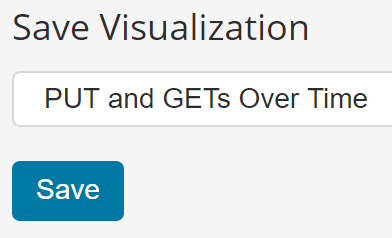
8. Click Save in the top toolbar:

9. Enter PUTs and GETs Over Time in the Save Visualization field, and click Save:
Creating a Kibana Dashboard
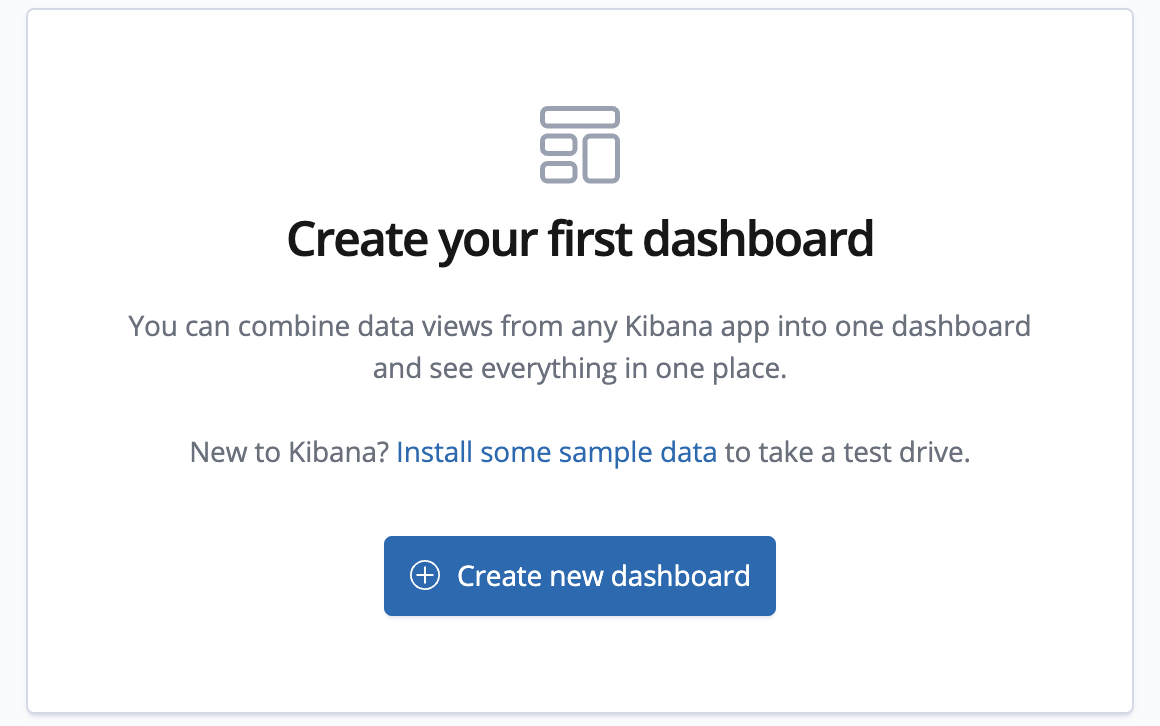
1. Click on Dashboard in the sidebar menu.
2. Click Create a dashboard:
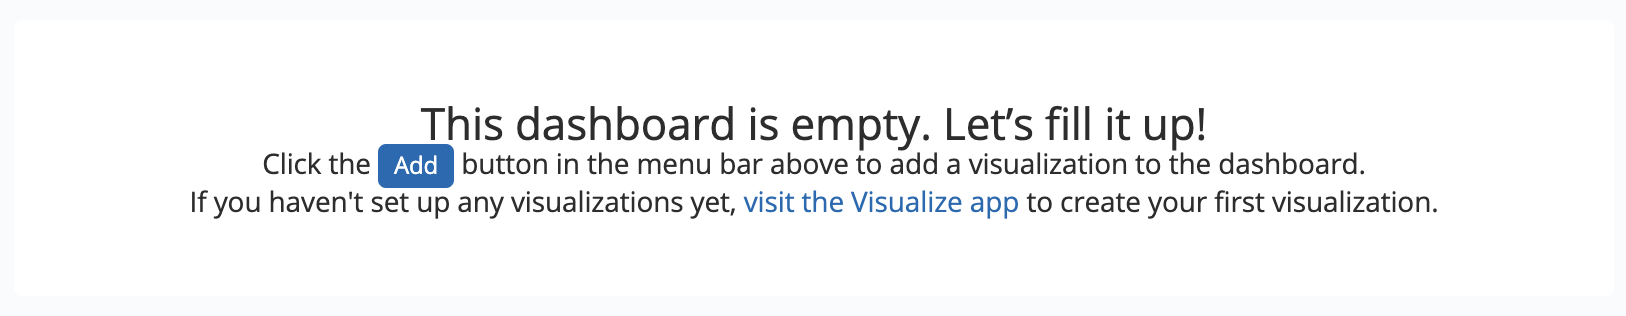
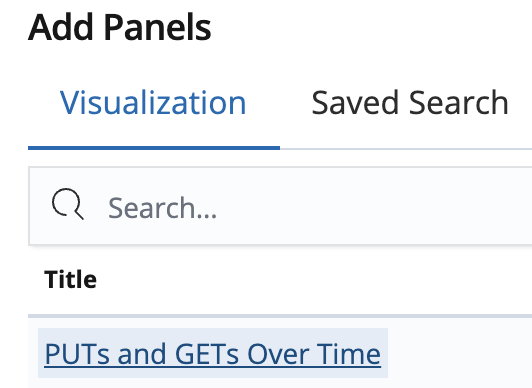
3. Click Add to add saved visualizations to the dashboard:
4. Select the PUT and GETs Over Time visualization:
The visualization is added to the dashboard, but the size may not be what you like. You can adjust the size of the visualization by dragging the arrow in the lower-right corner:

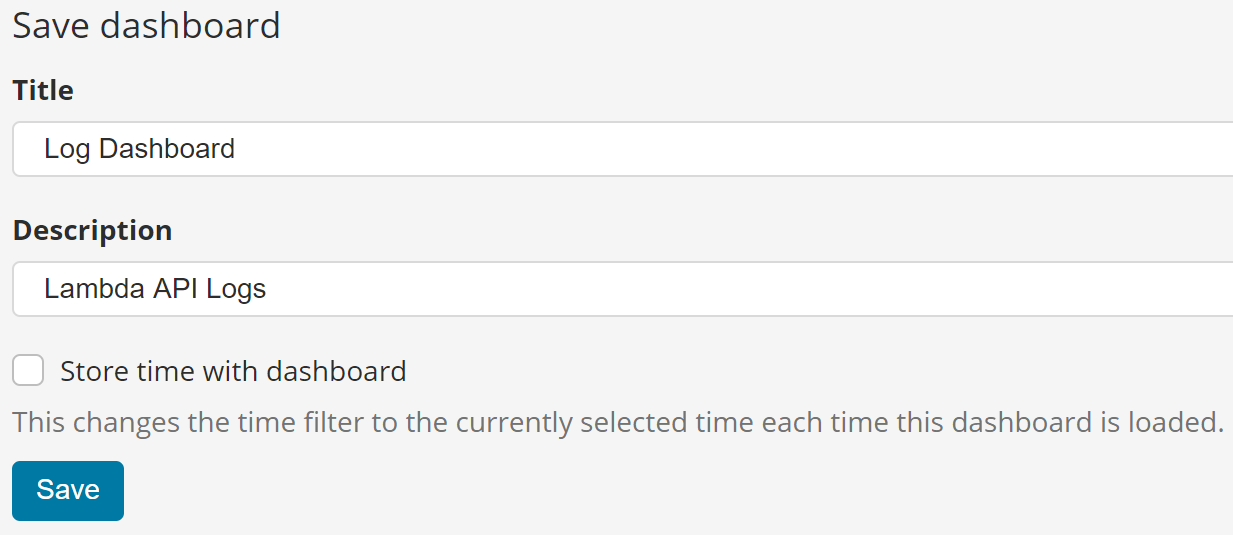
5. Click Save and enter the following values before clicking the revealed Savebutton:
- Title: Log Dashboard
- Description: Lambda API Logs
You’ve done it! The Dashboard will always contain the up-to-date statistics for your GET and PUT events that run through the Lambda function:
6. Return to the Lambda console and create as many test events as you want.
7. Refresh the Kibana dashboard and see the new requests in the visualization:
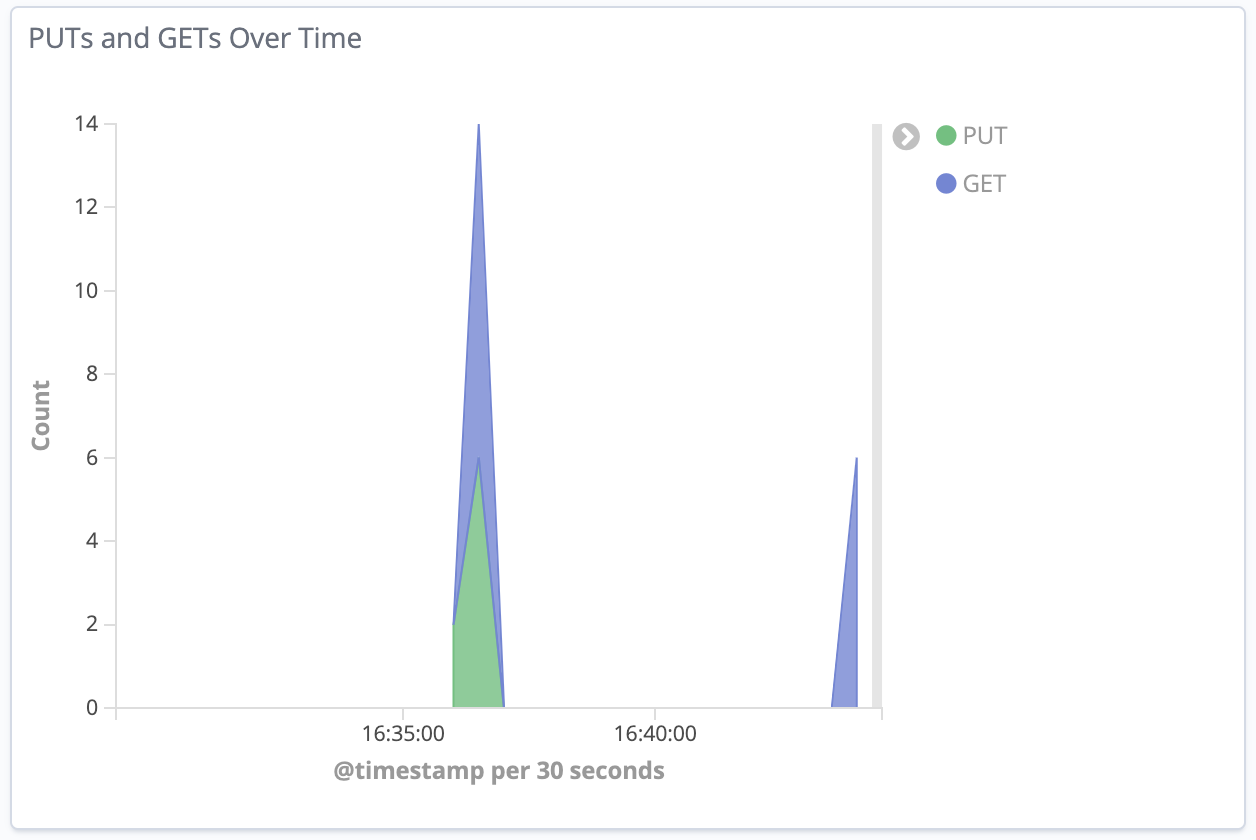
You can also configure Auto-refresh to avoid having to refresh the view: