Introduction to CloudWatch
On This Page
Lab
Explore CloudWatch
1. AWS has done an excellent job defining CloudWatch key concepts. Read the abbreviated excerpt from their official documentation below to obtain an understanding of Metrics, Namespaces and Alarms:
Metrics
A metric is the fundamental concept in CloudWatch and represents a time-ordered set of data points. These data points can be either your custom metrics or metrics from other services in AWS. You or AWS products publish metric data points into CloudWatch and you retrieve statistics about those data points as an ordered set of time-series data. Metrics exist only in the region in which they are created.
Think of a metric as a variable to monitor, and the data points represent the values of that variable over time. For example, the CPU usage of a particular Amazon EC2 instance is one metric, and the latency of an Elastic Load Balancing load balancer is another.
Namespaces
CloudWatch namespaces are containers for metrics. Metrics in different namespaces are isolated from each other, so that metrics from different applications are not mistakenly aggregated into the same statistics.
Note: In this lab you will see namespaces that AWS has created for you, and a custom namespace created by the steps performed in this lab.
Alarms
You can use an alarm to automatically initiate actions on your behalf. An alarm watches a single metric over a specified time period, and performs one or more specified actions, based on the value of the metric relative to a threshold over time. The action is a notification sent to an Amazon SNS topic or an Auto Scaling policy. You can also add alarms to dashboards.
Alarms invoke actions for sustained state changes only. CloudWatch alarms will not invoke actions simply because they are in a particular state. The state must have changed and been maintained for a specified number of periods.
The interested student can take a look at the full version of the documentation here. Due to time constraints, you should look at additional documentation once you have completed the lab.
2. In the AWS Management Console search bar, enter CloudWatch, and click the CloudWatch result under Services:
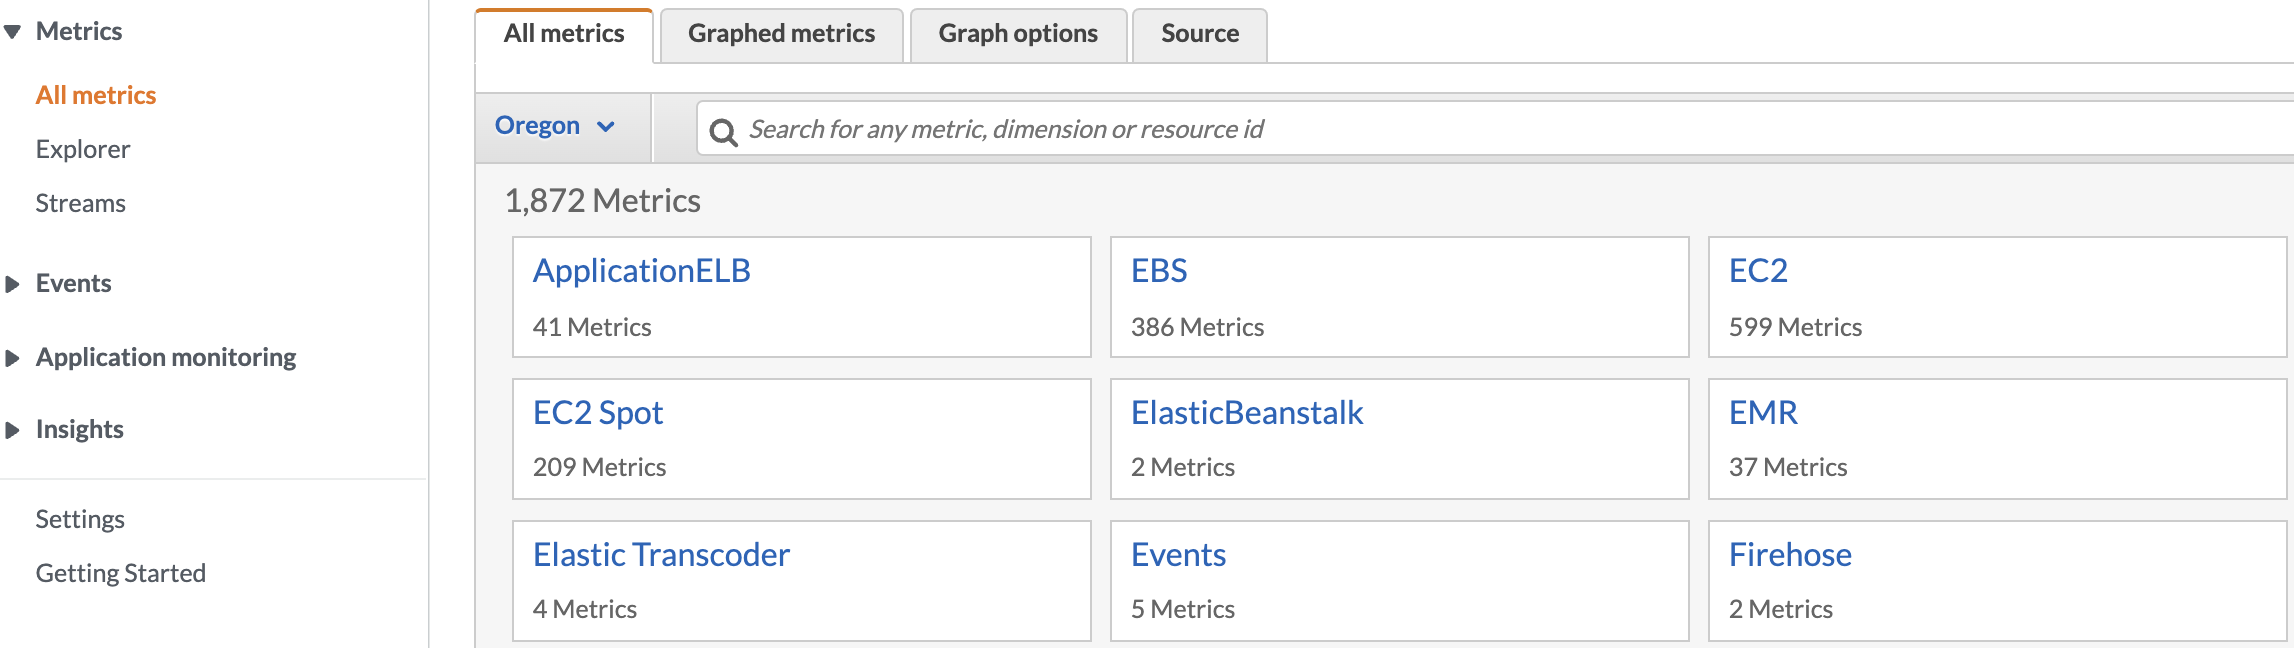
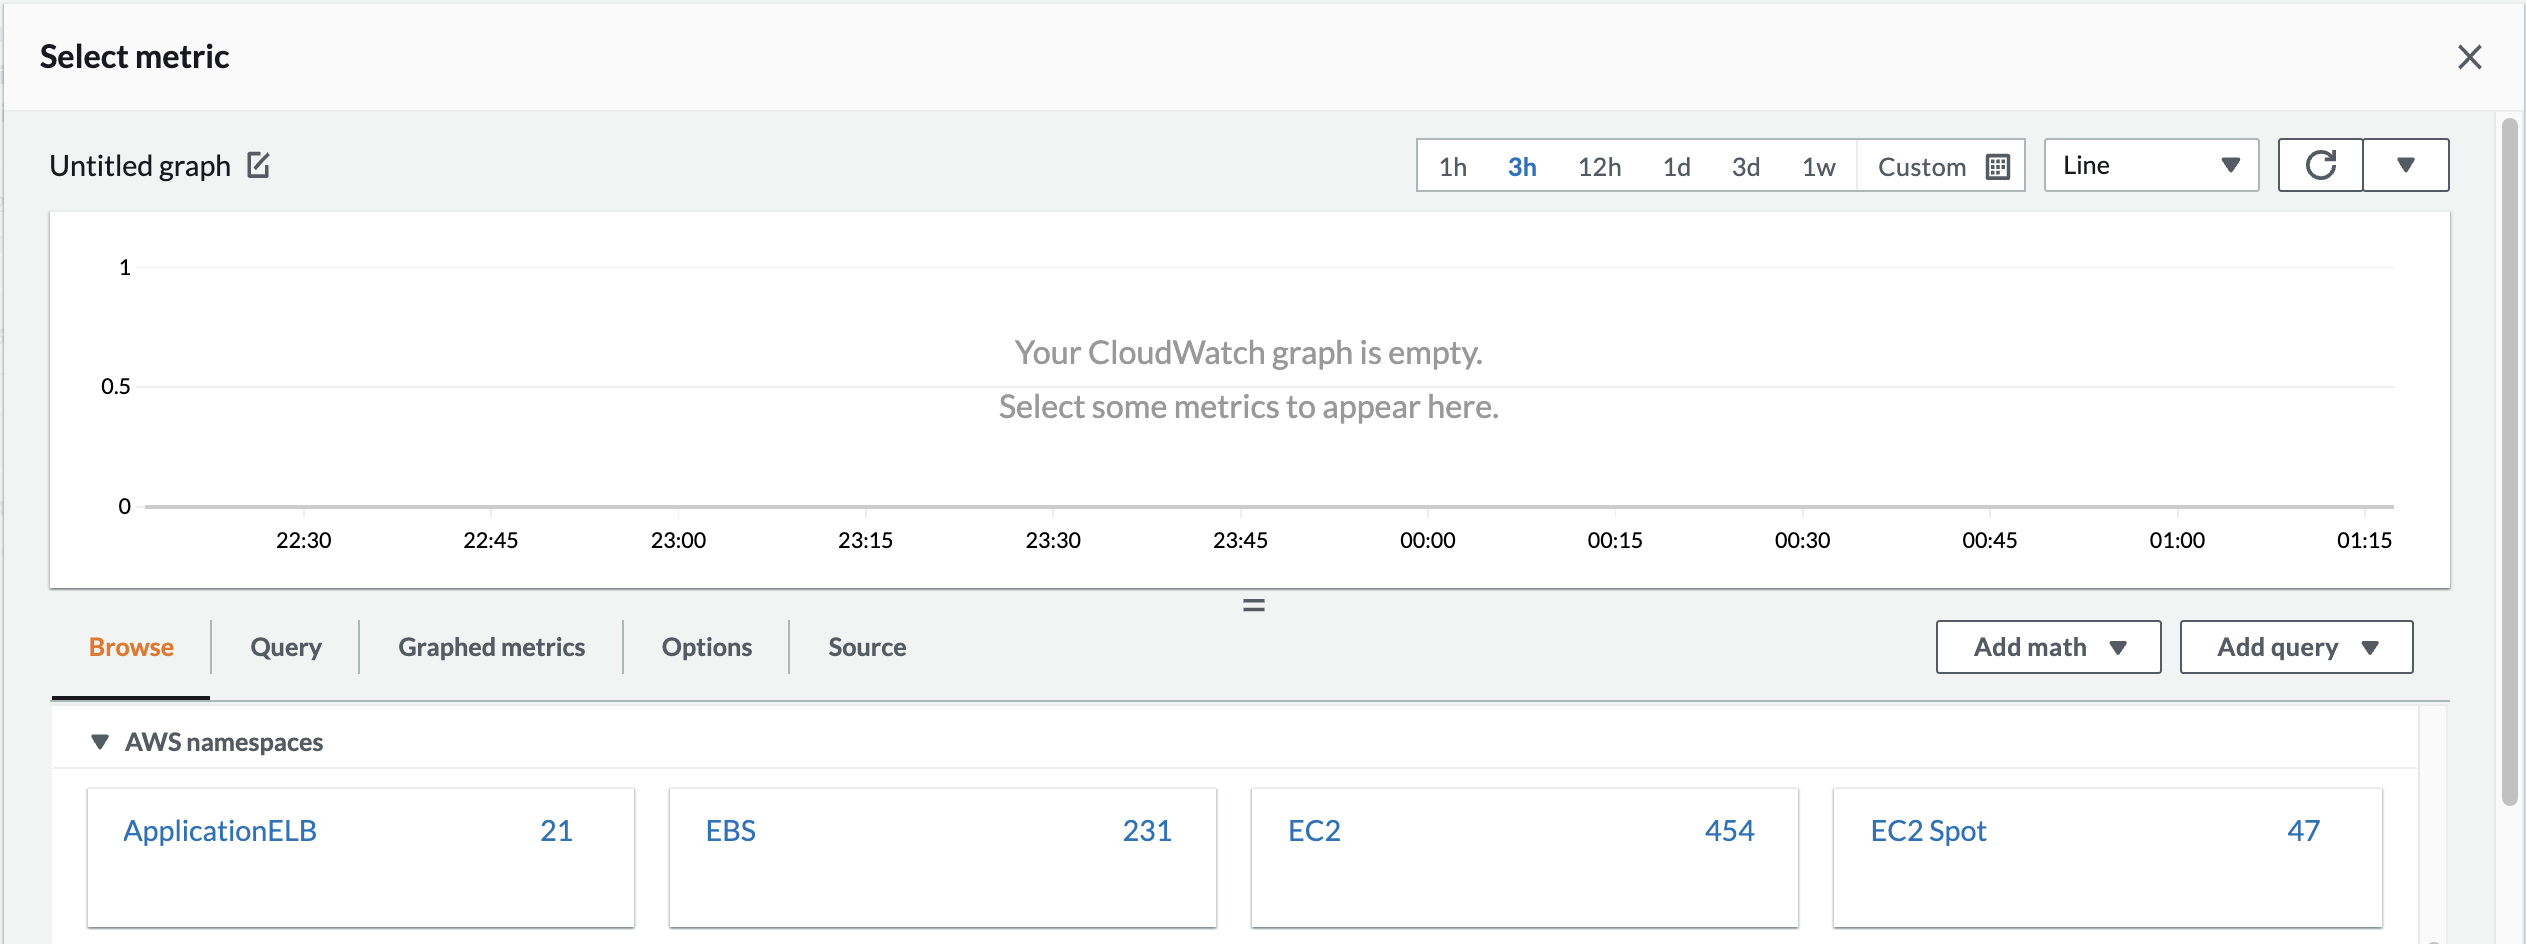
3. Click Metrics > All metrics in the left navigation pane. At this point, there are most likely no custom namespaces. But several AWS namespaces may already be established for you. What metrics are listed on the All metricstab depends on a couple of factors:
- How quickly you arrived at this view after starting your lab. This lab creates an EC2 instance and EBS volume when you start the lab. After a couple of minutes of delay, metrics for the EC2 and EBS namespaces are included.
- How recently your Cloud Academy AWS account has been used to complete other Cloud Academy labs. If the AWS account you logged in to recently completed other labs, you may see namespace related to metrics collected in those labs.
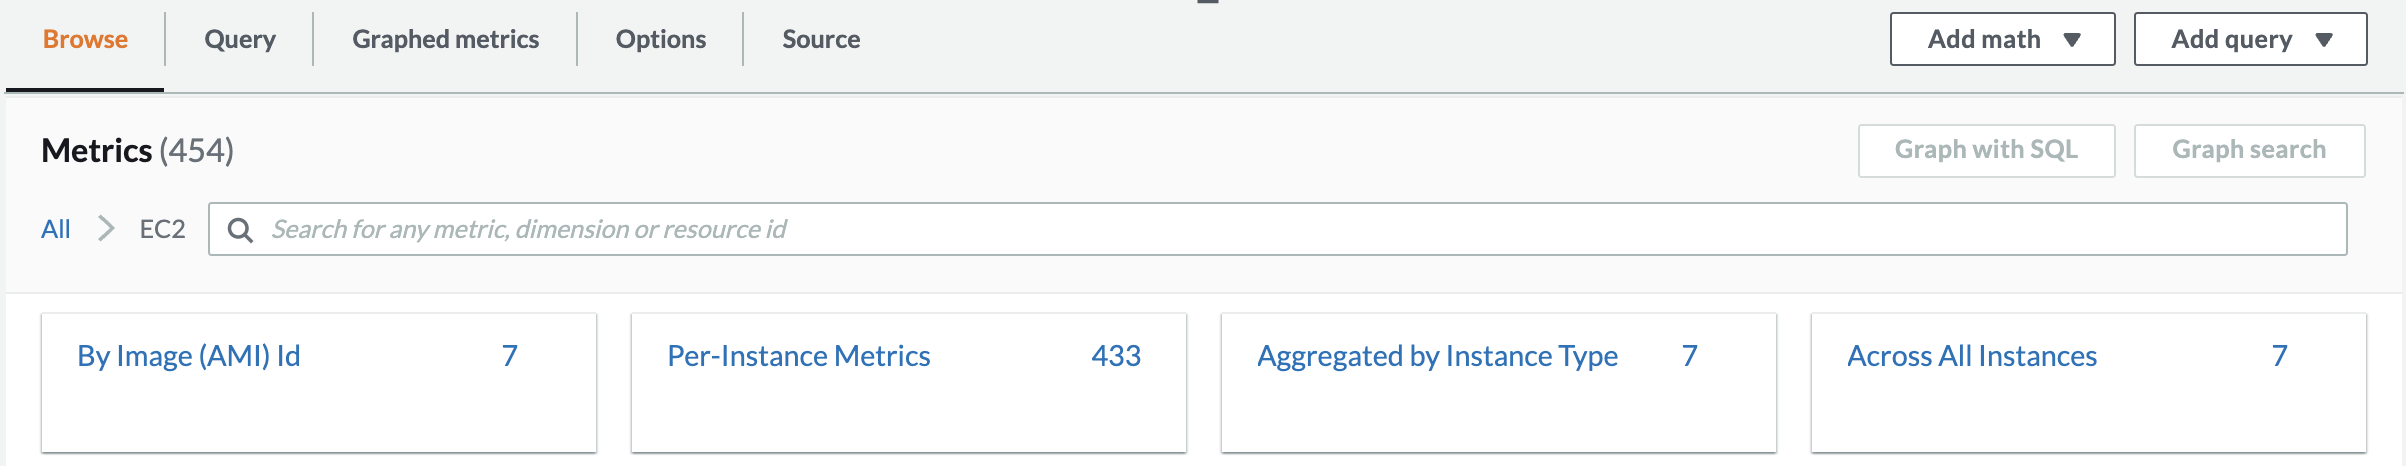
4. Spend a few minutes to explore what metrics and namespaces look like in the CloudWatch console. Simply select any namespace and then any particular metric. As an example, the EC2 namespace and CPUUtilizationmetric for the HighCPUInstance are selected in the image below:
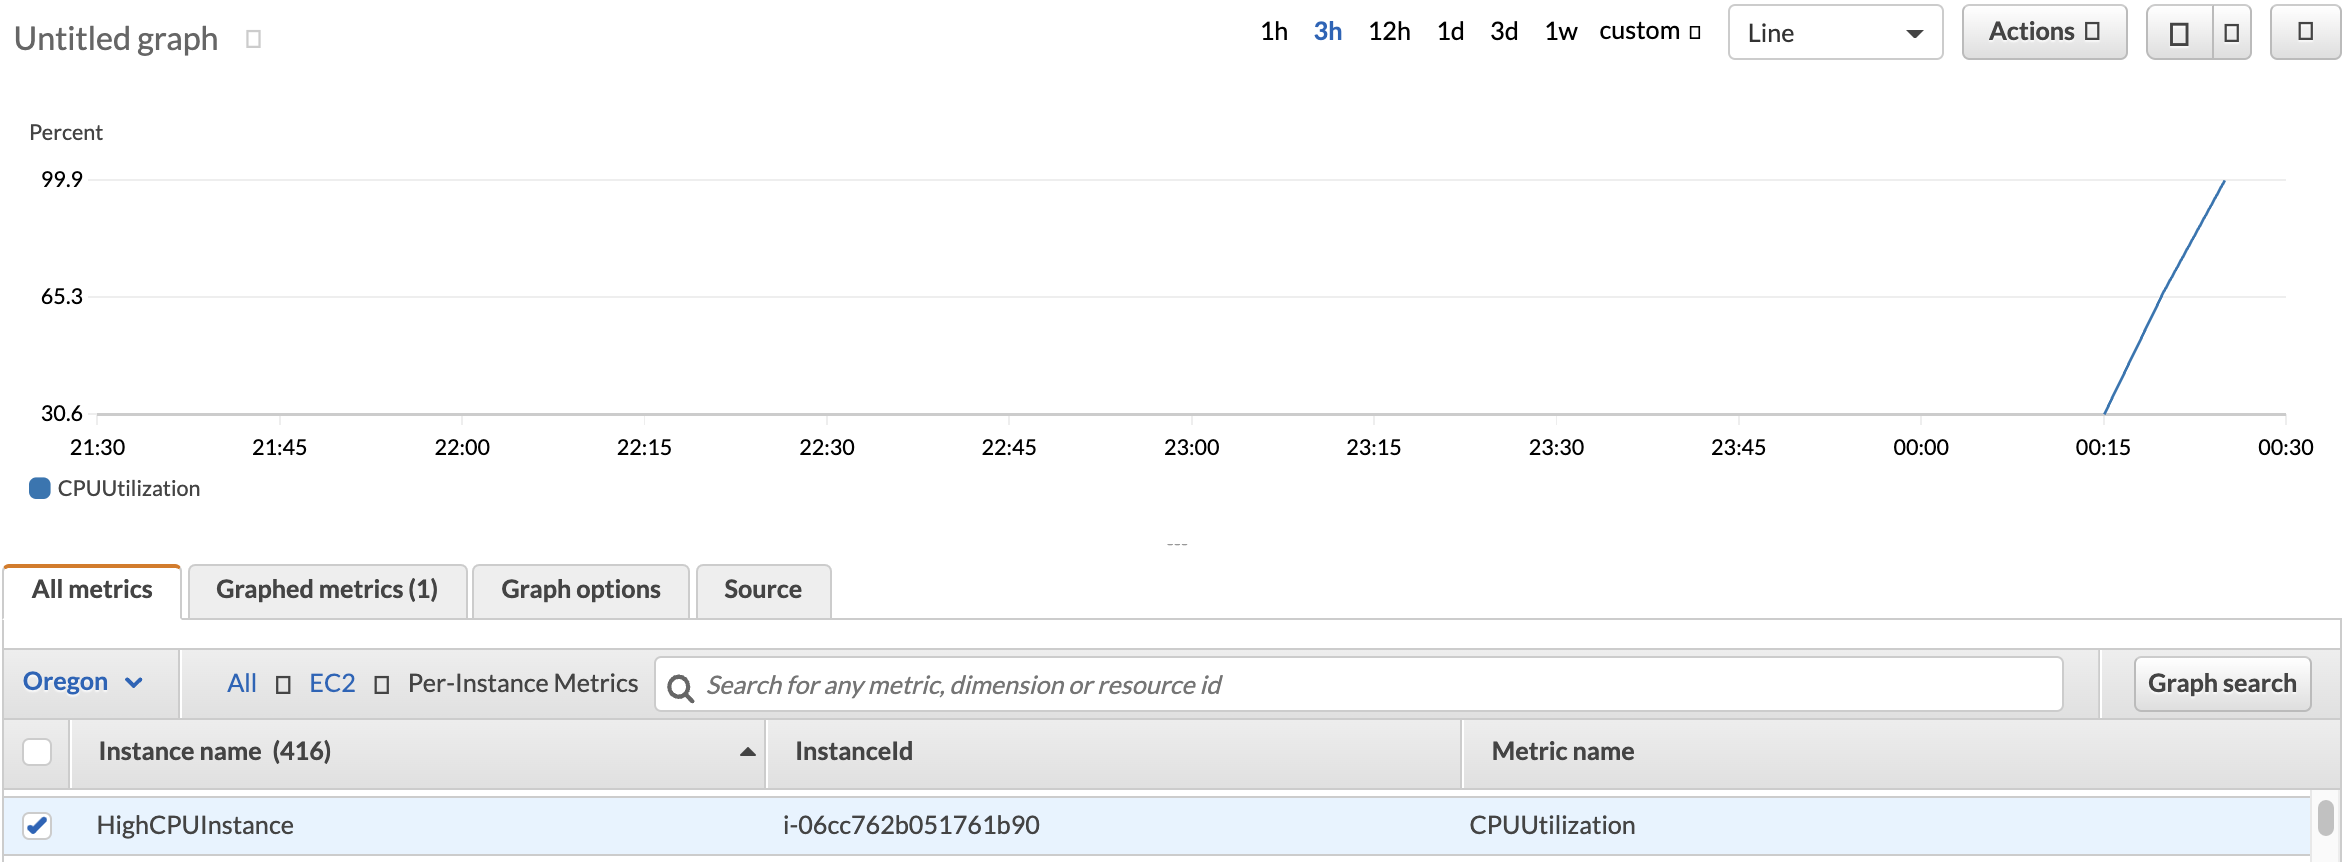
Note: The image above is for illustrative purposes only, you do not need to choose the same instance or metric to explore CloudWatch metrics.
The longer the instance has been running, the more data points will appear in the graph. By default, EC2 metrics are collected every five minutes. You may need to adjust the displayed timeline to 1 week (1w) or further in the past to see some metrics.
Monitoring EC2 Instances
1. In the AWS Management Console search bar, enter EC2, and click the EC2 result under Services:
2. Click Instancesfrom the navigation pane and select the box near the instance name. A wealth of instance information is displayed in the Details tab:
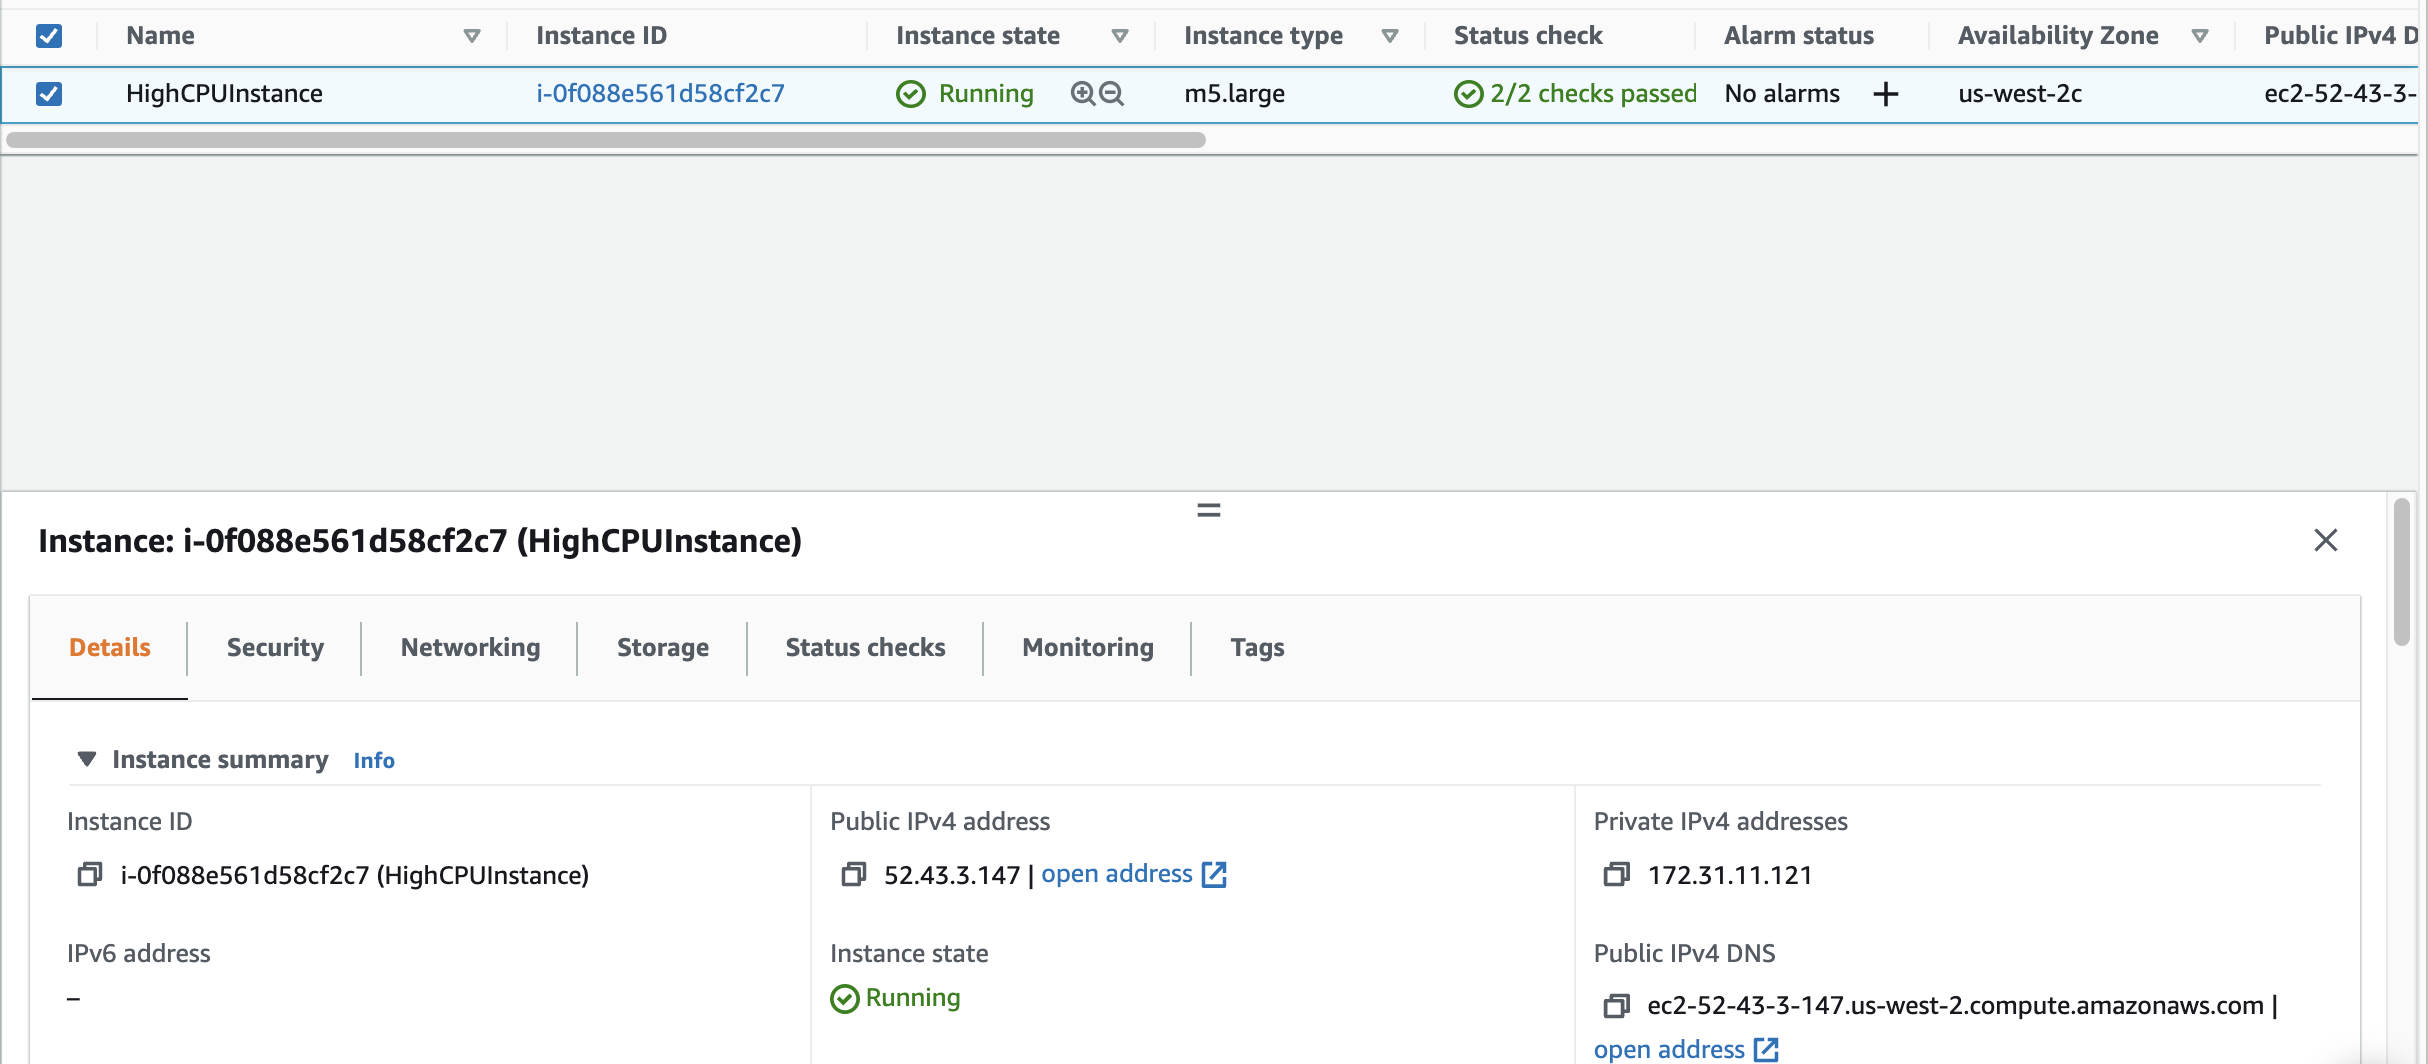
When you started the Lab, Cloud Academy configured the lab environment for you. This includes a medium instance named HighCPUInstance.
Note: Your information will vary. There is additional instance information not shown in the example above.
3. Switch to the Monitoring tab and take a look at the standard metrics:
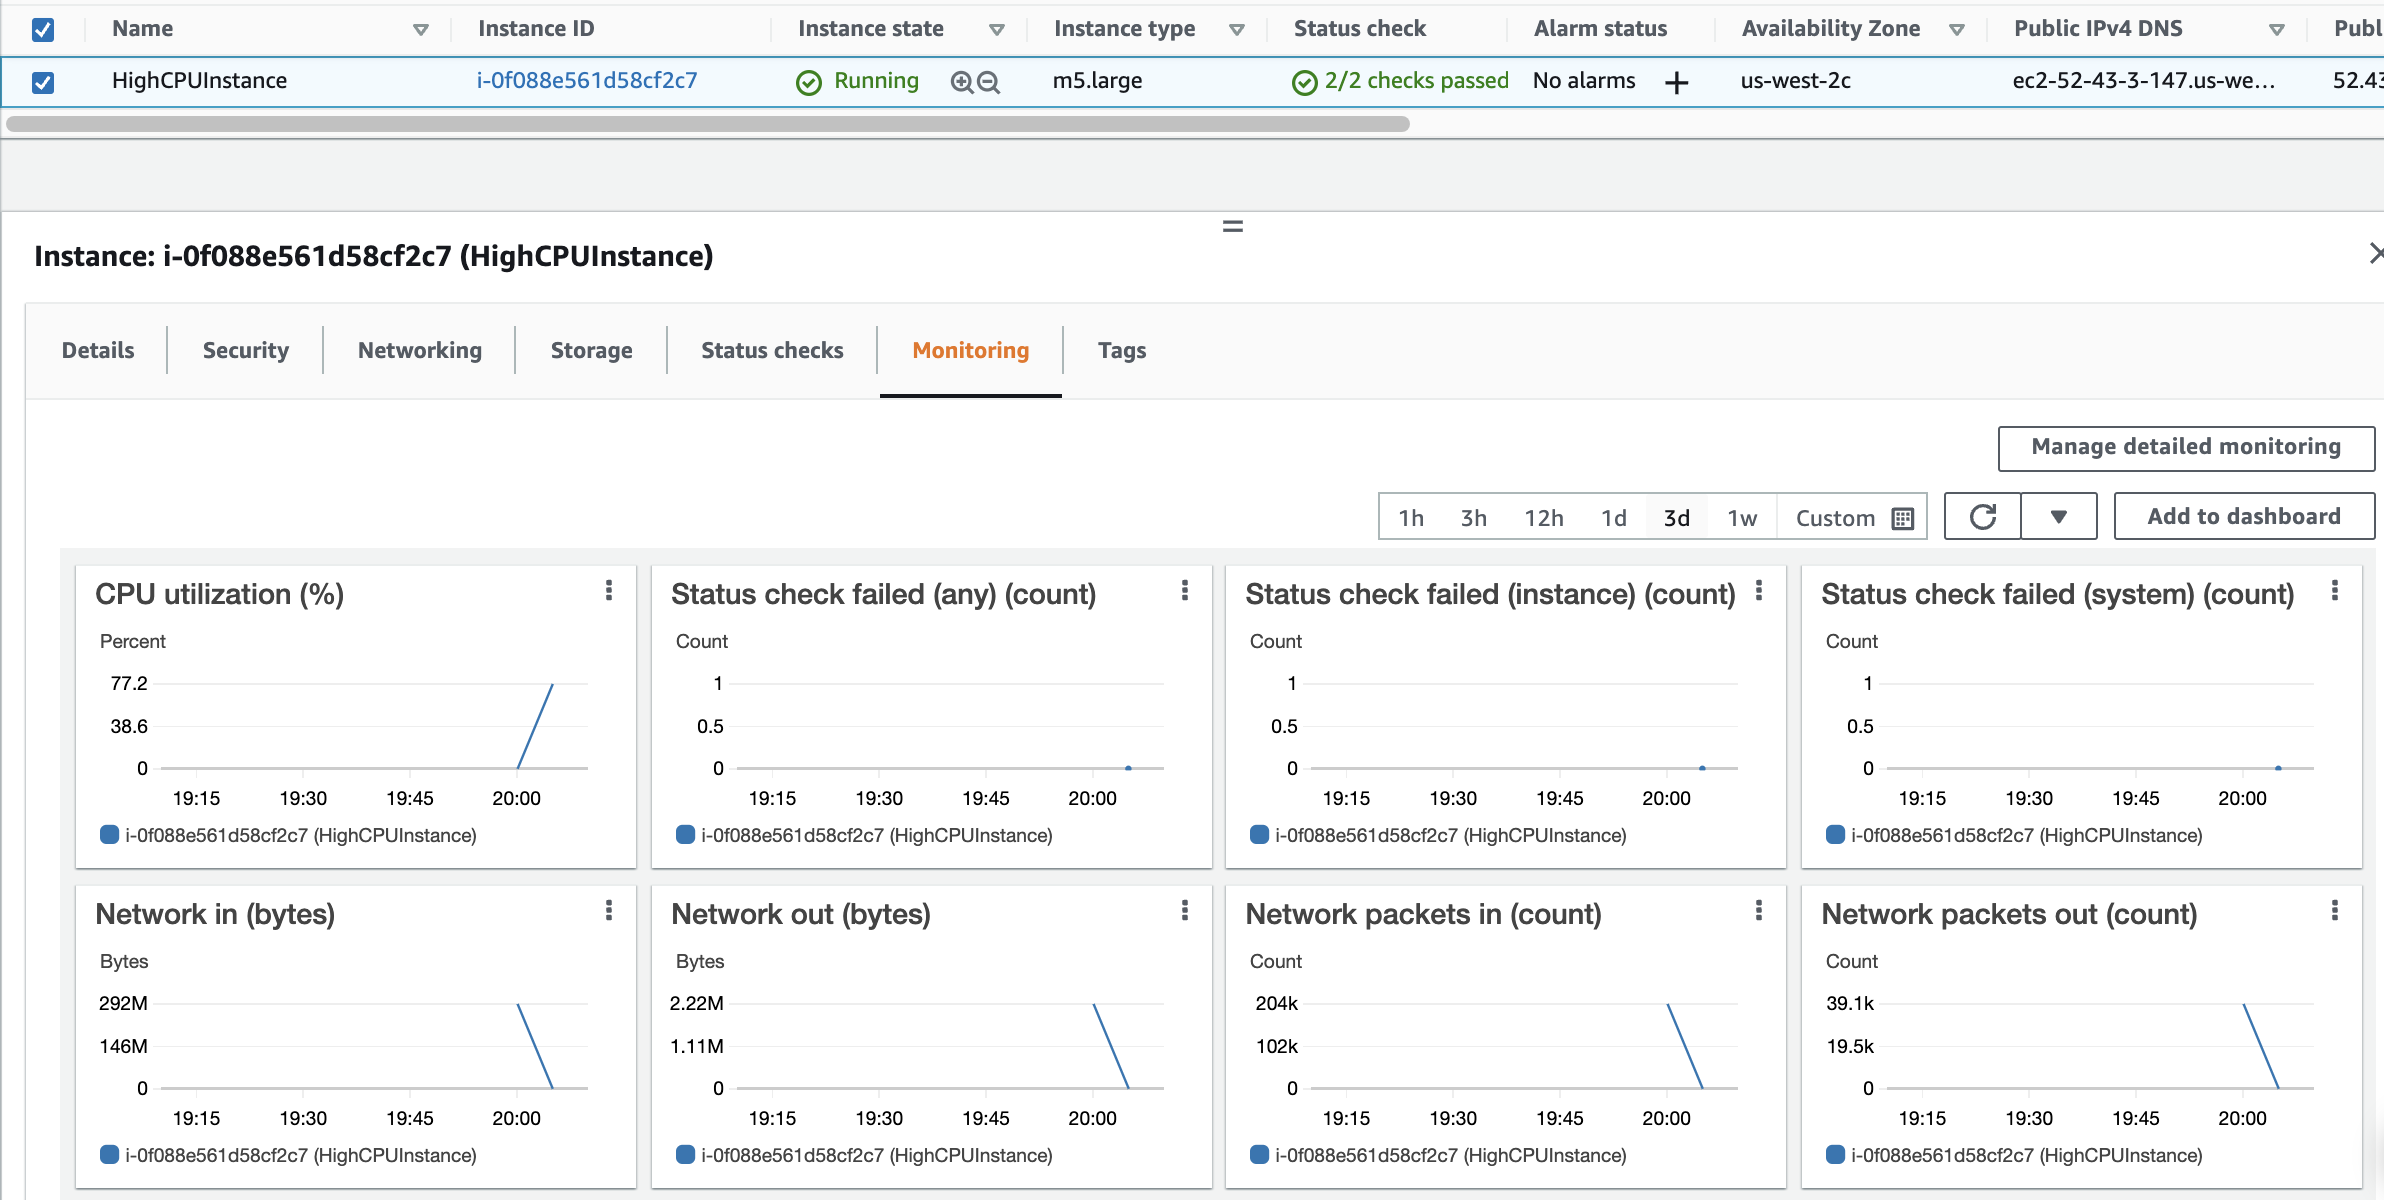
Note: If you don’t see an instance yet, it’s possible that it’s still provisioning in the background. Refresh the page every minute or so until it appears.
These are the standard metrics that CloudWatch monitors for all your EC2 instances. Please refer to the documentation for details. (Due to possible time constraints, please look up additional information in the documentation after completing this lab.)
You should be aware that all the metrics in this tab related to Disk (Disk Reads, Disk Read Operations, Disk Writes, Disk Write Operations) pertain to ephemeral storage disks. Those metrics will not represent anything if you have launched an EBS backed instance. To see the metrics related to EBS volumes you need to look elsewhere. Next you will take a look at the metrics of the EBS volume for this particular instance.
Note: Ephemeral storage is also known as instance storage. It is temporary storage that is added to your instance, unlike EBS which is an attached volume that is permanent in nature.
4. To enable and disable detailed monitoring, click Manage detailed monitoring:
The Detailed monitoring page will open :
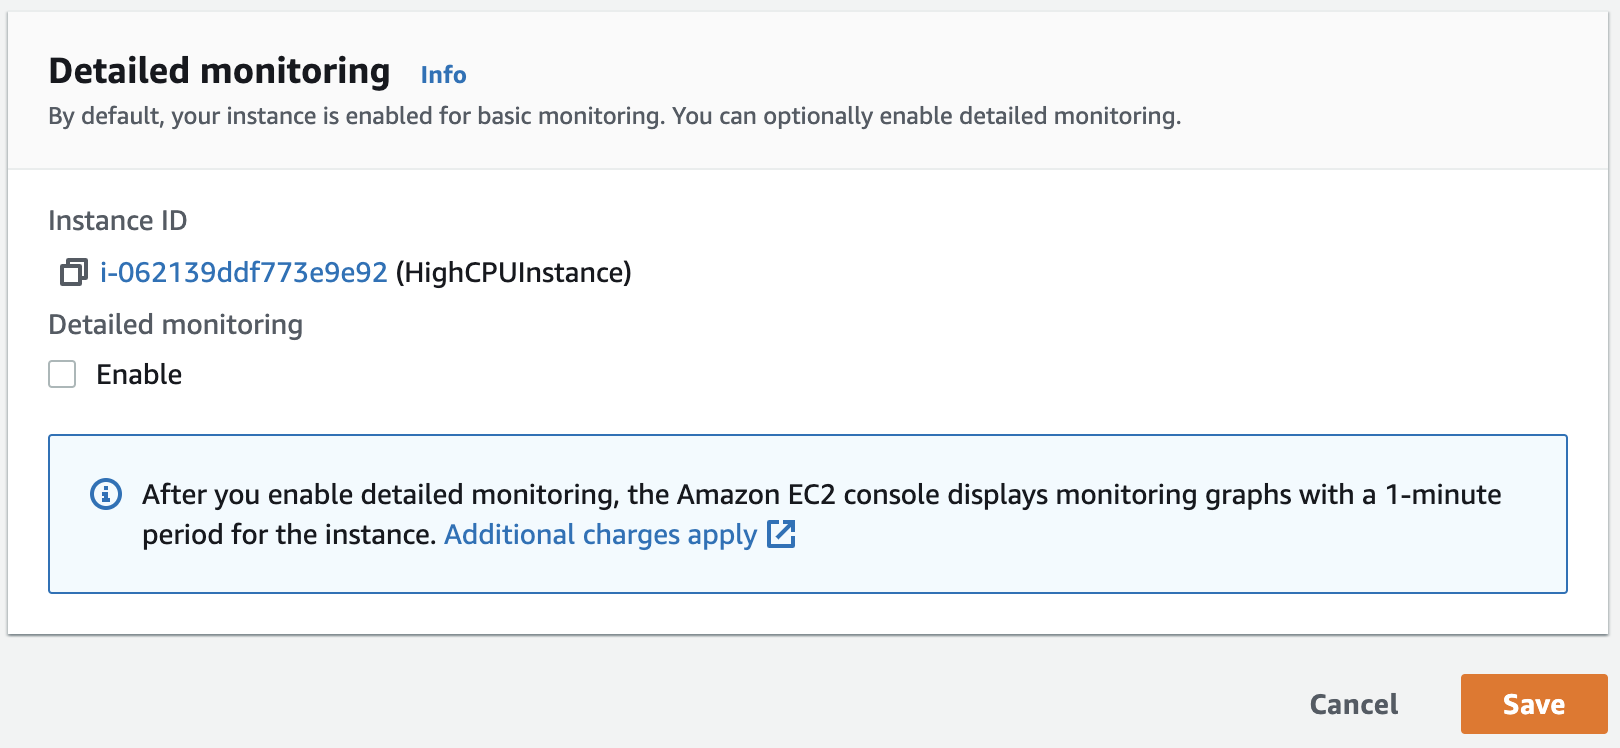
Here you can enable and disable detailed monitoring by checking or unchecking the Enable checkbox followed by clicking Save.
5. Click Cancel as we will not be enabling detailed monitoring in this lab:
6. Reselect the HighCPUInstance , click the Storage tab. Scroll down and click on the Volume Id (lower right):
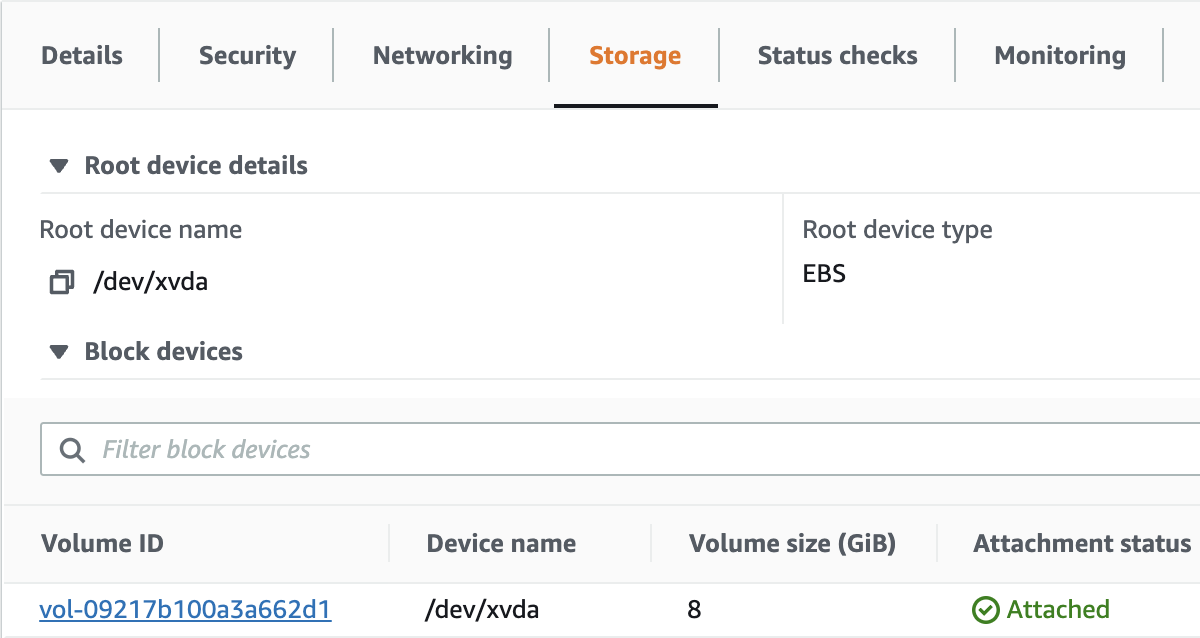
7. Select the volume and click on the Monitoring tab to see the metrics for this EBS volume:
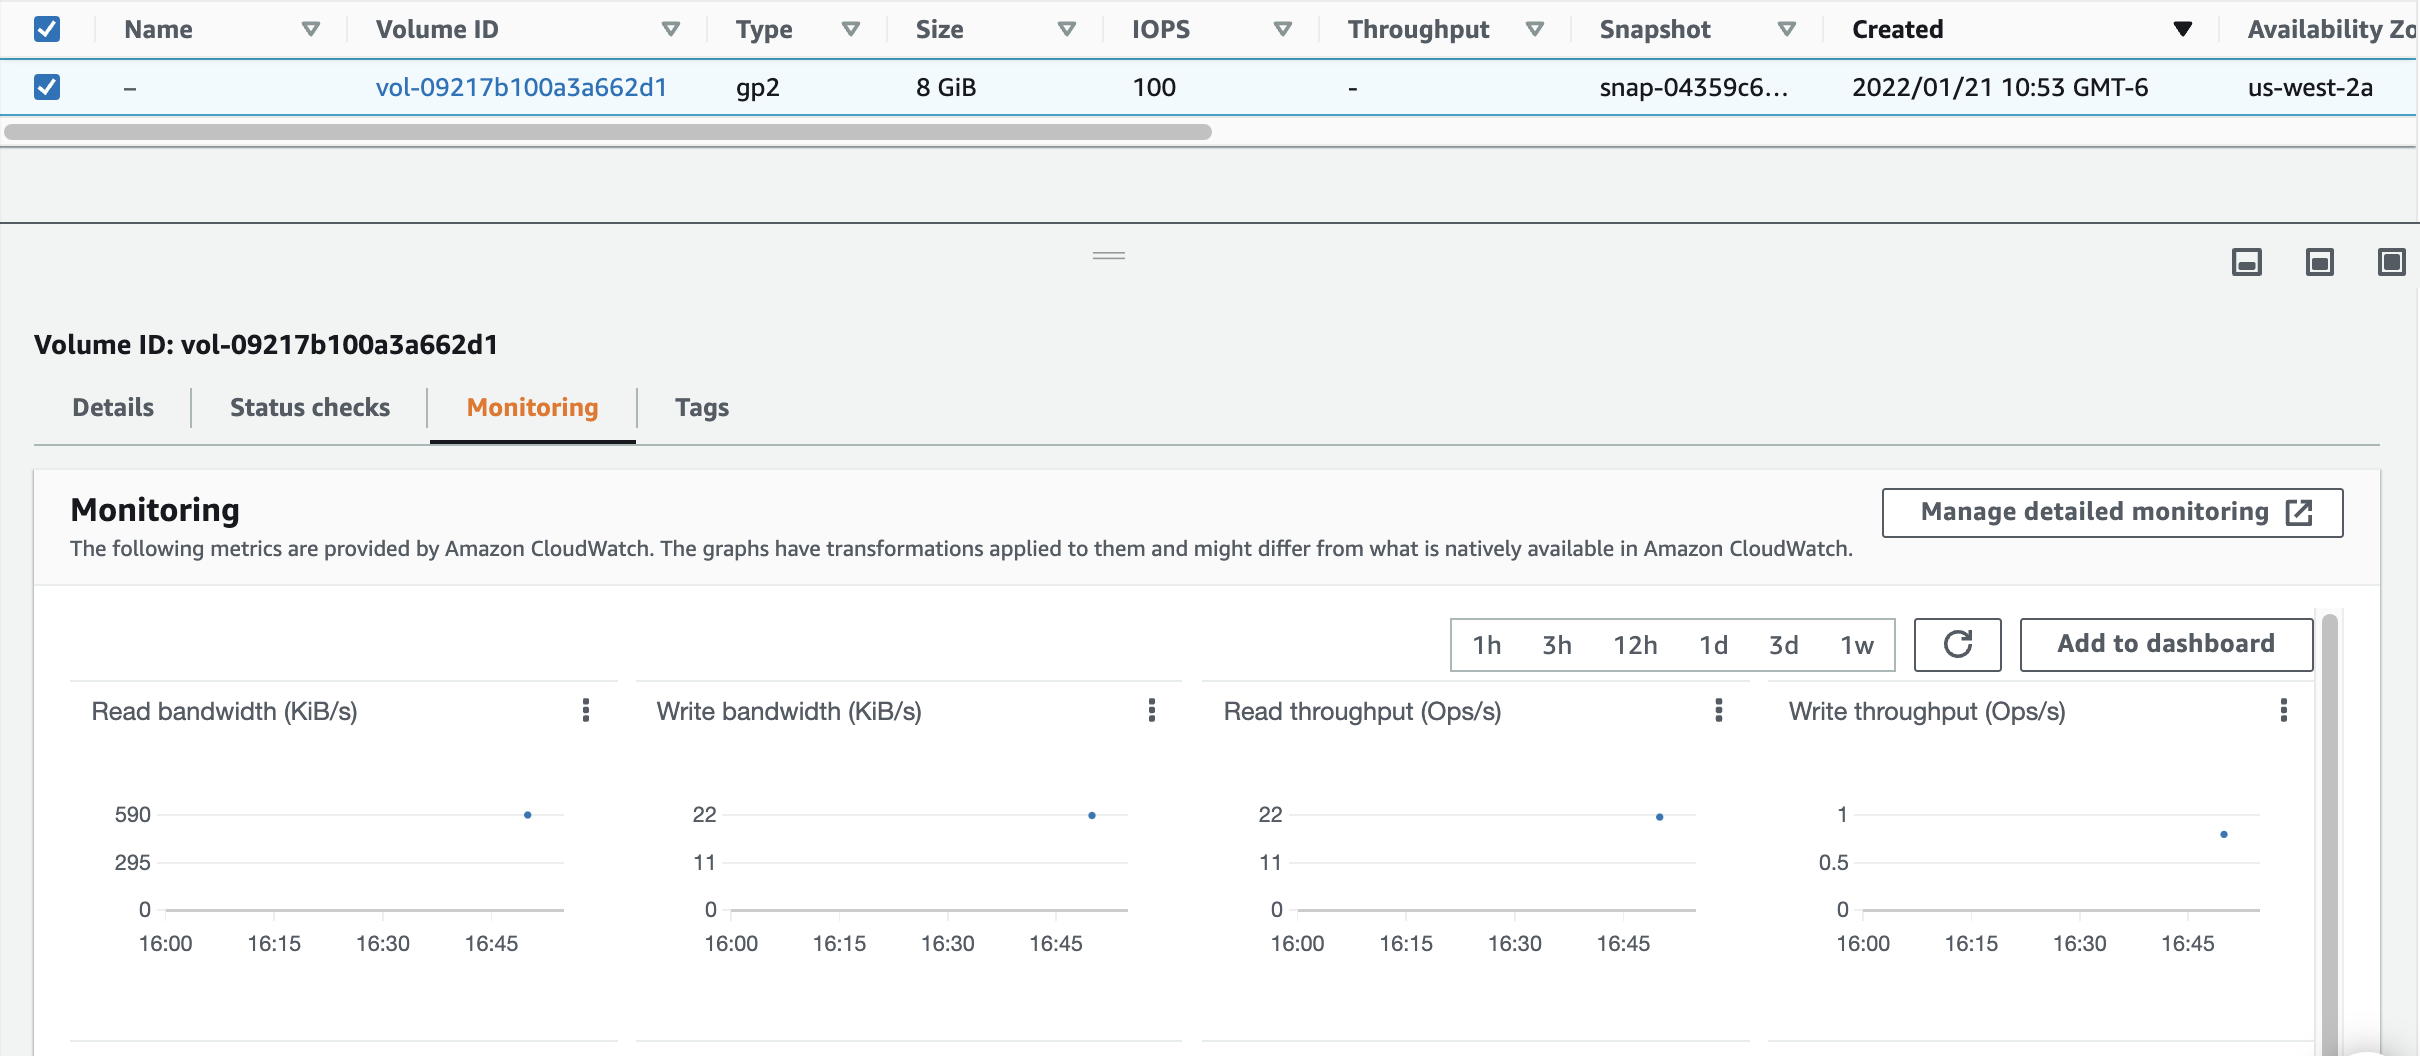
As you can see, Amazon does quite a bit out of the box with respect to monitoring EC2 Instances and EBS volumes. However, you can enable Detailed Monitoring for even more control over the monitoring frequency of EC2 instances. CloudWatch monitors EC2 instances every 5 minutes by default. If you need more frequent monitoring, you can enable CloudWatch’s Detailed Monitoring feature to monitor your instances every minute. You can enable Detailed Monitoring during the instance launch or change it anytime afterwards. Note: Detailed Monitoring does come with an associated cost.
Install the EC2 Monitoring Scripts
1. Navigate to EC2 Instances by clicking here.
2. Click on Launch instances:

3. In the Application and OS Images section, select the Amazon Linux option under Quick Start:

4. In the Instance Type section, you should not change any options. Simply make sure the default t2.microis selected:

5. In the Key pair section, select the keypair:

Note: Your keypair may differ from the screenshot. Reminder: The PEM or PPK formatted key pair can be downloaded directly from the Your lab data section of the Cloud Academy Lab page at any time.
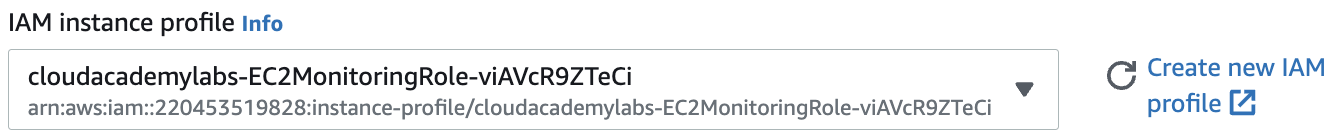
6. Scroll down and expand the Advanced details section. Under IAM instance profile, select the IAM role provided. It will have a name that looks similar to cloudacademylabs-EC2MonitoringRole-XXXXXXXXXX :
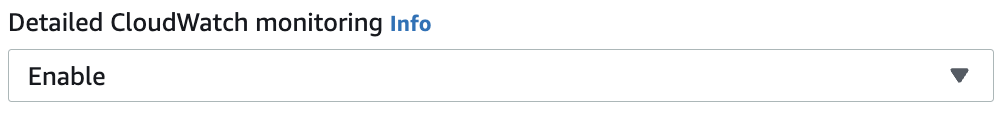
7. Scroll down to Detailed CloudWatch monitoring and select Enable:
8. Scroll down to User data and copy and paste the following bash script code in the User data (As text) field:
This is where the magic happens. Next you will insert the code to execute during the instance launch. However, in order to send metrics to CloudWatch, you need to configure some credentials first. You can use either Access Keys or IAM roles for this task. In this Lab, you will follow the best practices and use IAM roles. There is an instance role already created in you account configured with the proper permissions.
!/bin/bash
yum install -y perl-Switch perl-DateTime perl-Sys-Syslog perl-LWP-Protocol-https perl-Digest-SHA.x86_64 wget http://aws-cloudwatch.s3.amazonaws.com/downloads/CloudWatchMonitoringScripts-1.2.2.zip unzip CloudWatchMonitoringScripts-1.2.2.zip rm CloudWatchMonitoringScripts-1.2.2.zip echo “/1 ** * /aws-scripts-mon/mon-put-instance-data.pl –mem-util –disk-space-util –disk-path=/ –from-cron” > monitoring.txt crontab monitoring.txt rm monitoring.txt
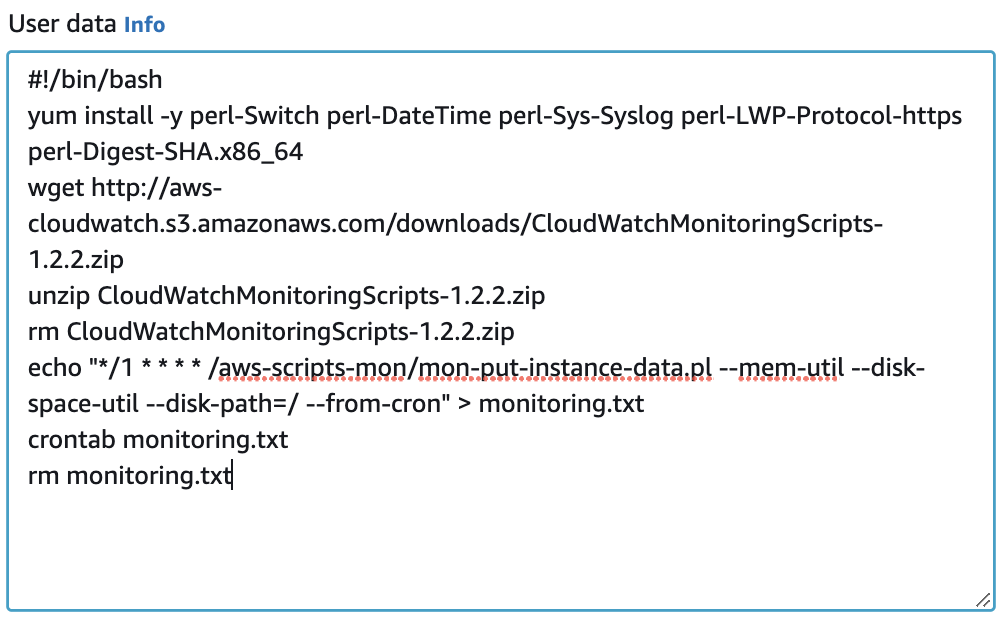
This bash script will get executed the first time the instances launches. In summary, the script will:
- Install Perl libraries
- Retrieve and install the AWS CloudWatch Monitoring scripts
- Configure crontab to run the monitoring script every minute
9. In the Summary section, click Launch instance:

A confirmation page will let you know that your instance is launching:

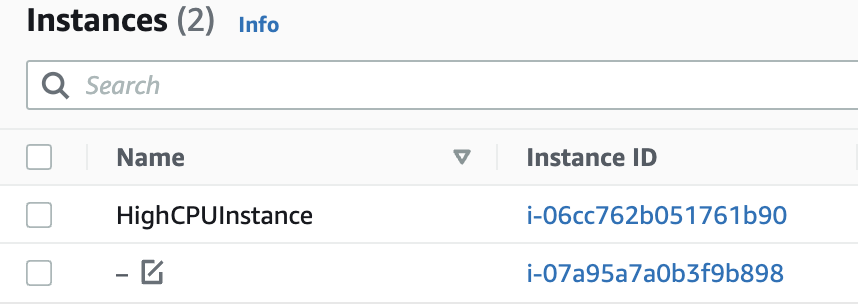
10. Click View all instances.
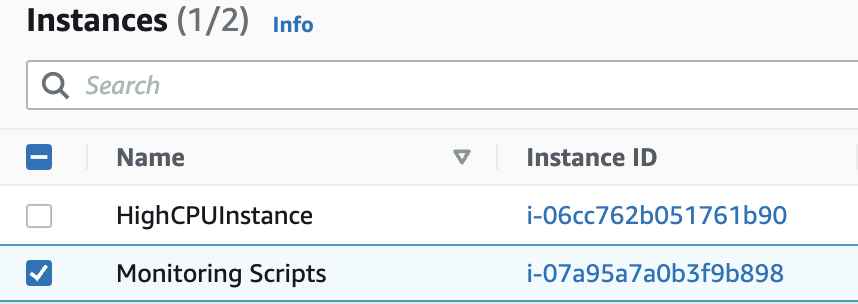
Notice the Name for the new instance is blank by default. Although not mandatory, it is helpful to have a name. Move your mouse into the blank space in the Name column. It turns to an edit pencil. Use the pencil to change your Instance Name to Monitoring Scripts:
Wait until theInstance State is R****unningfor the new Instance. It typically takes less than one minute for the state to transition fromP****ending to R****unning.

11. Navigate back to CloudWatch by clicking hereand clickAll metricsfrom the navigation pane. Notice that there is a new namespace called System/LinuxunderCustom namespaces:
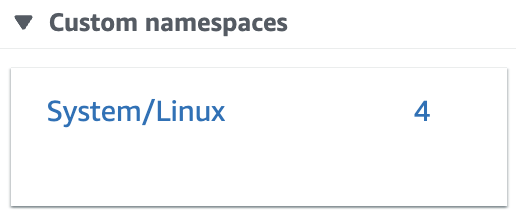
This name is configured when you send the custom metrics.
Note: If you don’t see the new Namespace wait a few minutes and refresh the page. CloudWatch takes some time to display the information in the dashboard. Recall that the newly installed monitoring scripts send data every minute based on the crontab configuration setup in the User data bash script for the instance.
12. Click on the new System/Linux namespace:
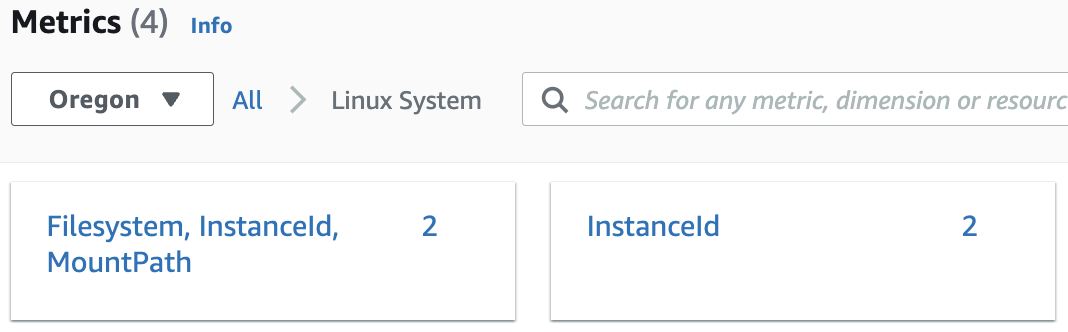
There are two metrics being monitored by CloudWatch in the custom System/Linux namespace. (Filesystem, InstanceId, MountPath and InstanceId)
13. Click the metric on the left (Filesystem…), then select the checkbox so the first metric is graphed.

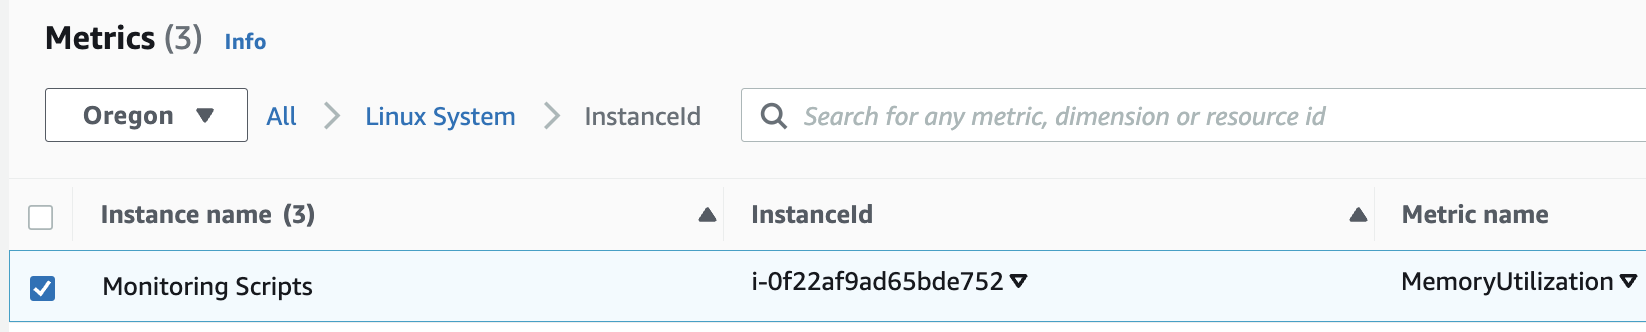
14. Click Linux System, so the Metrics path is All > Linux System again. Now select the metric on the right (InstanceId) and select its checkbox as well.

15. Switch to the Graphed metrics tab. If you selected both metrics correctly the tab will include a “(2)” at the end of it indicating how many metrics are graphed. Your graph should look similar to the following:
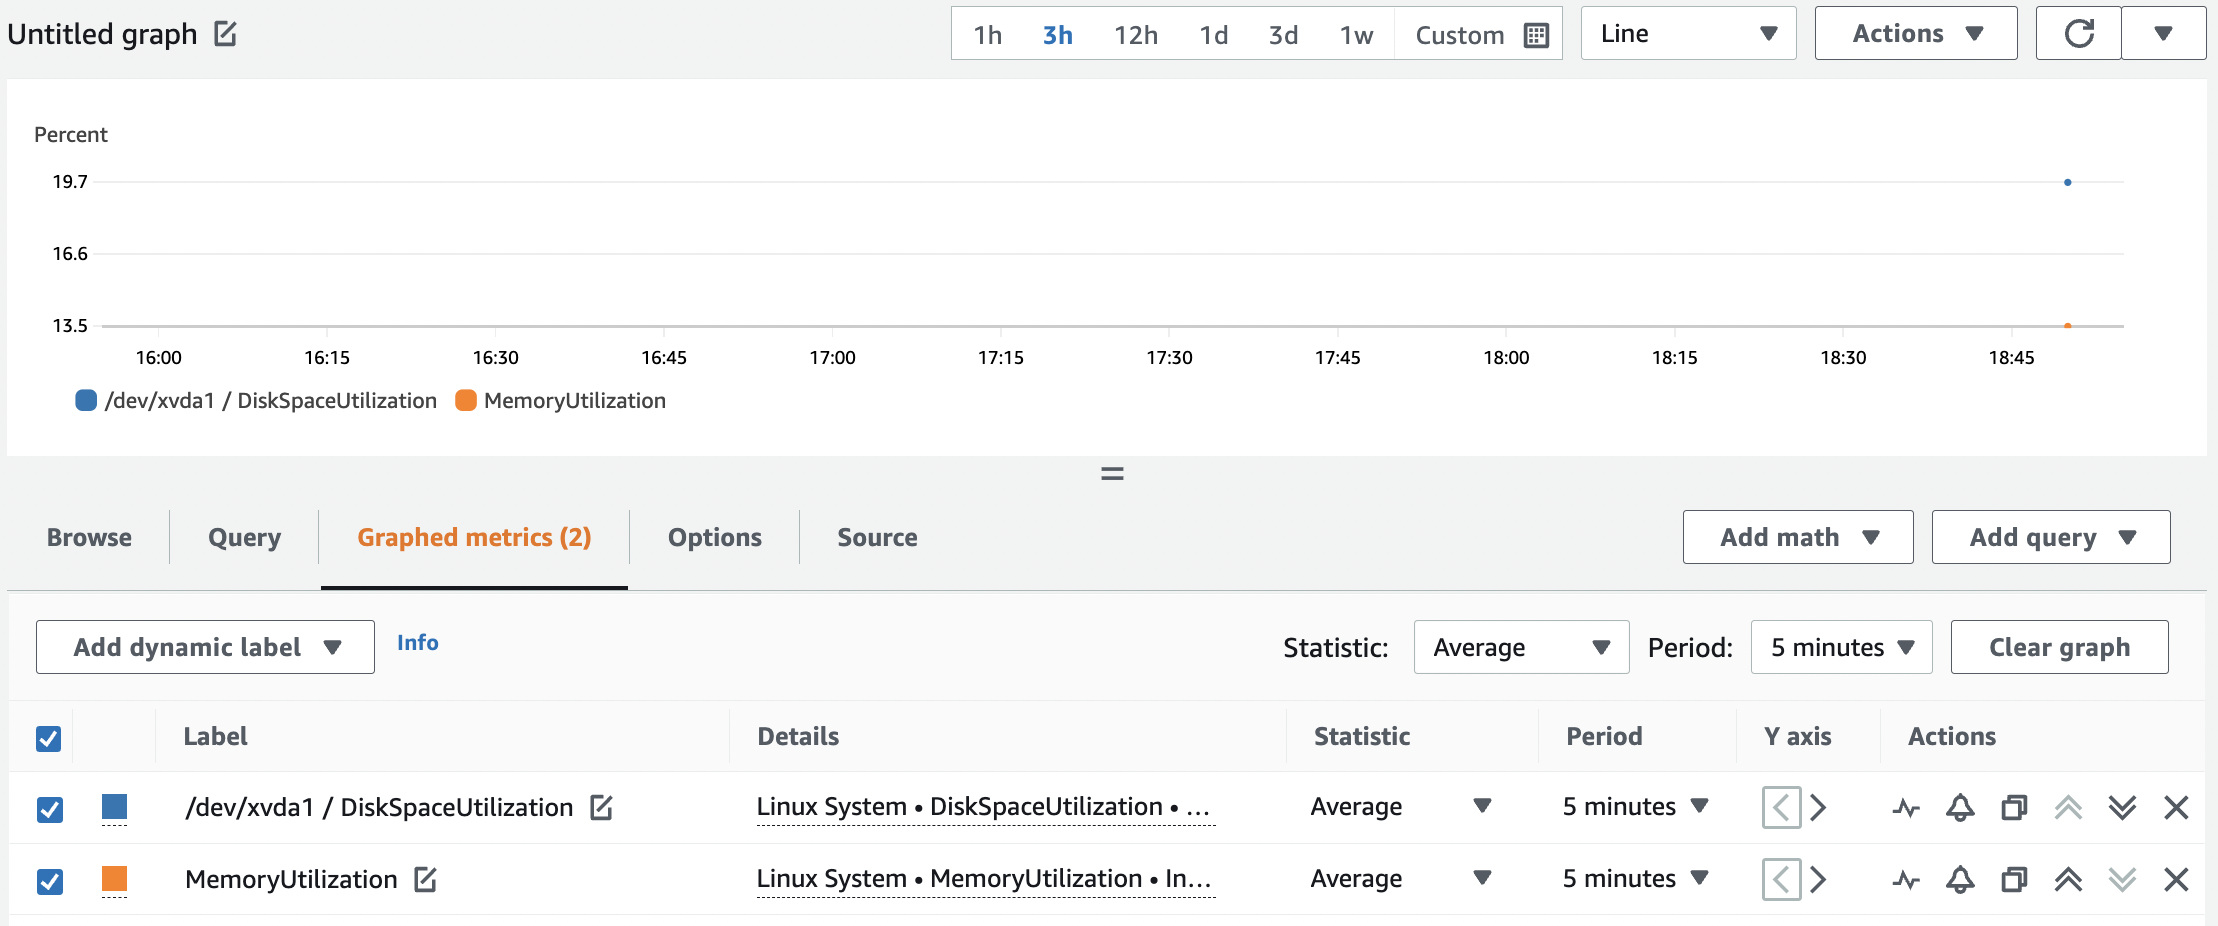
It is simple to customize the display to meet your needs for the metrics displayed.
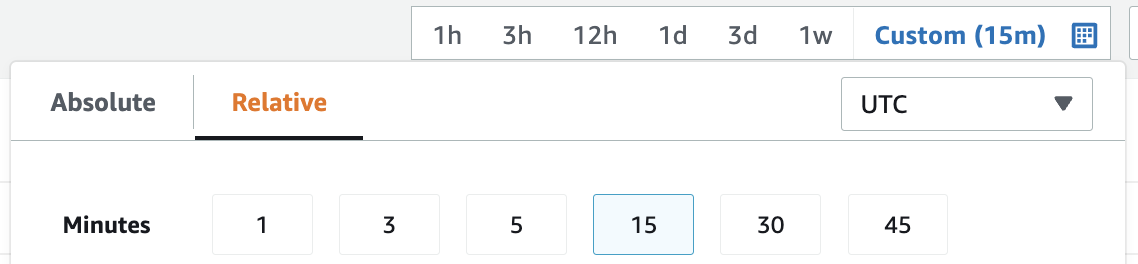
16. Click the custom graph period drop-down above the graph display area and select 15from the Minutesrow:
17. Select the Period drop-down column menu for each metric in the lower Graphed metrics tab and choose 1 Minute:
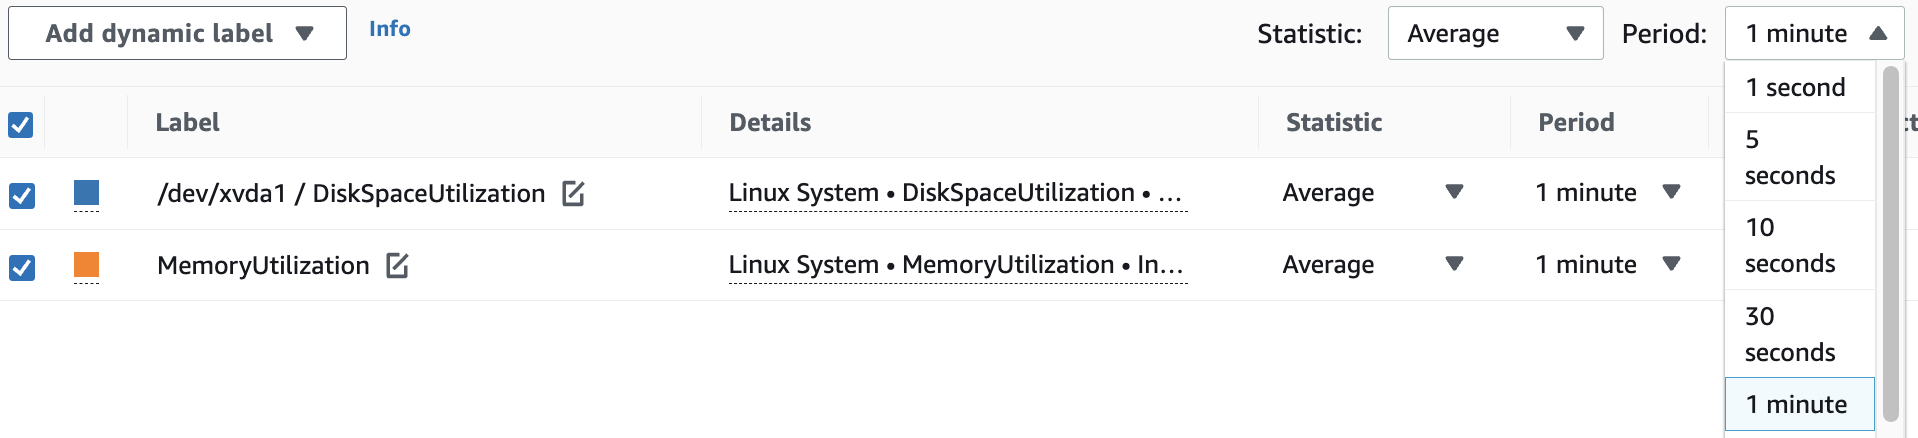
You can now see the highest resolution metrics that are being sent to CloudWatch every minute. (You may need to refresh the chart after setting the new periods)
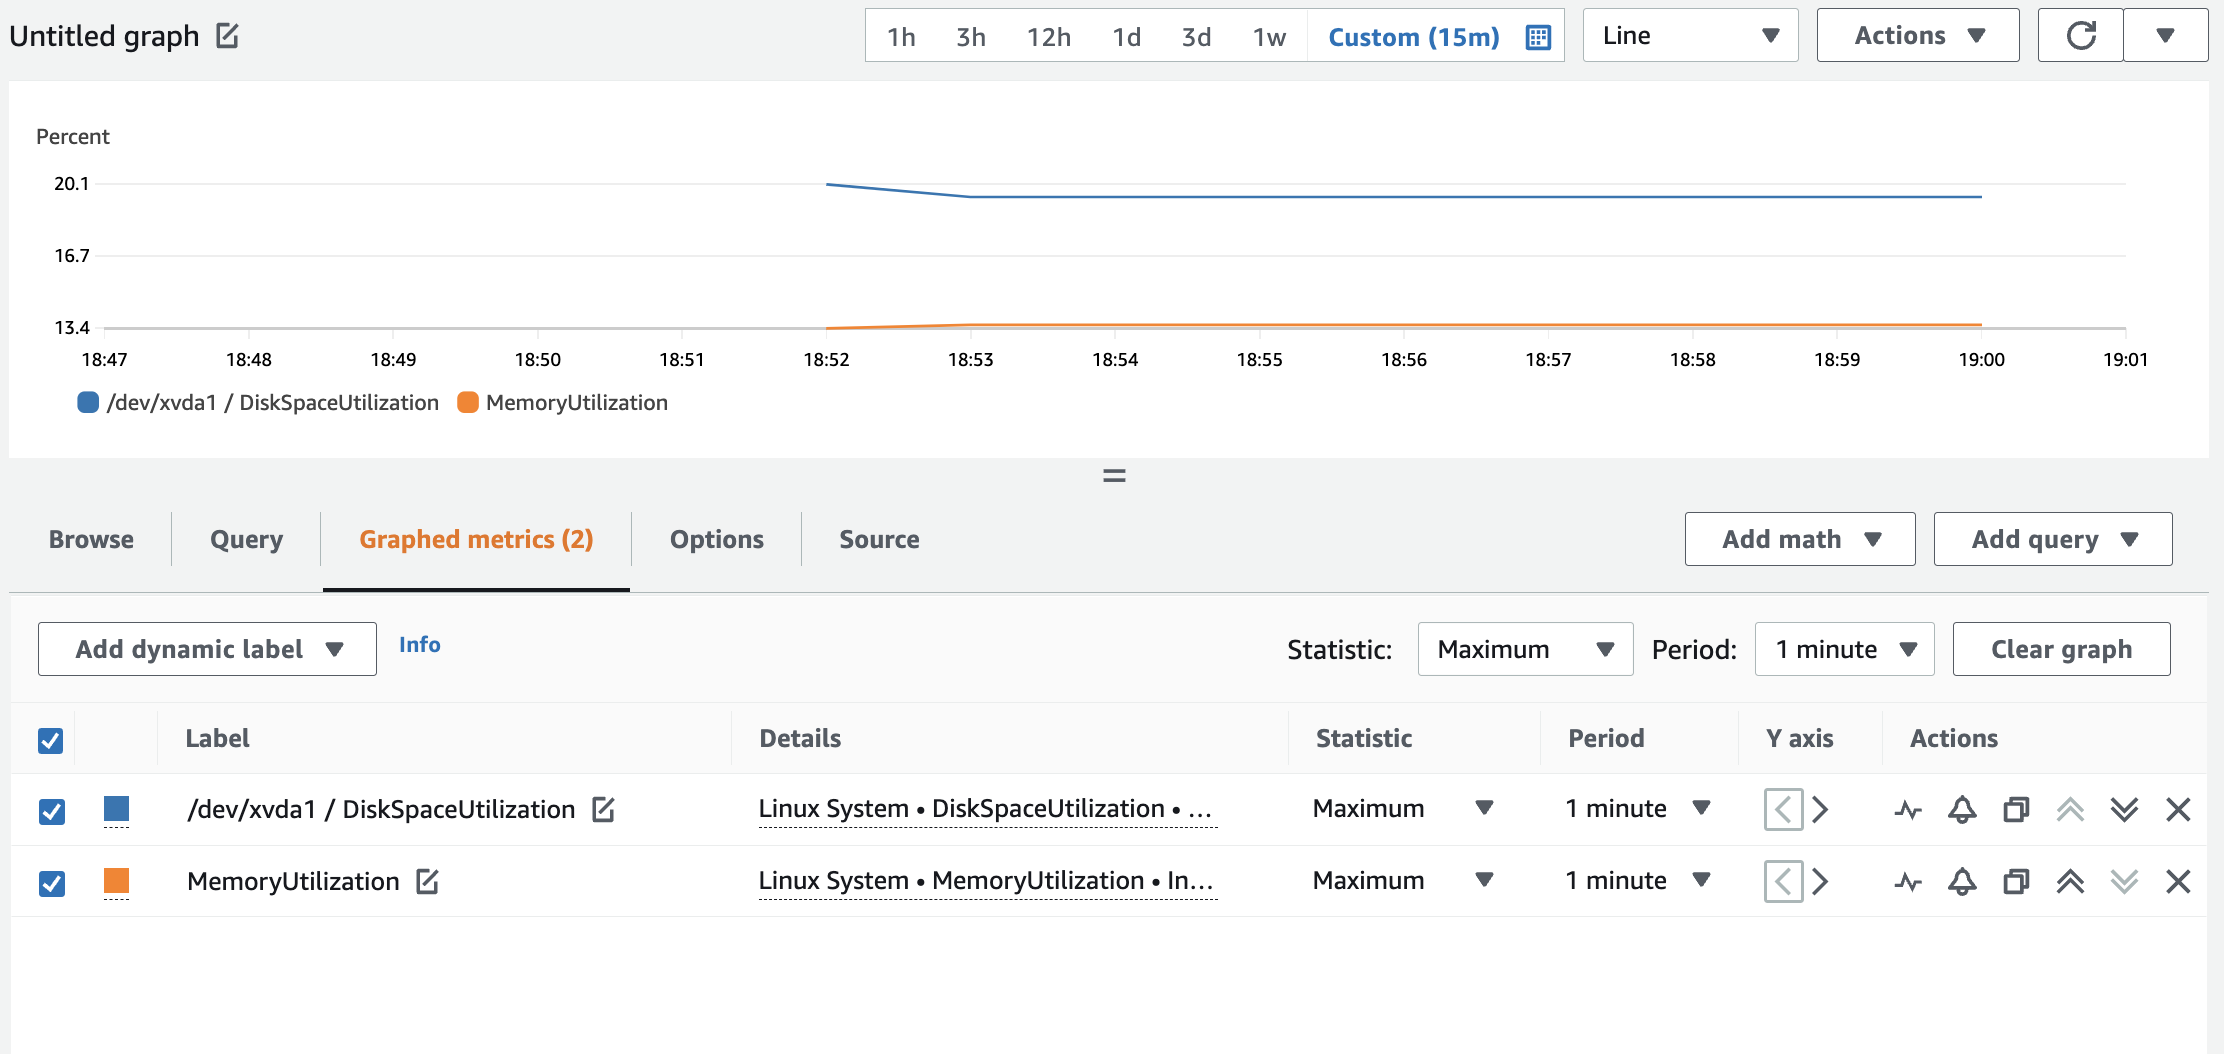
18. Select Maximum for the Statisticcolumn. Instead of an average of the datapoints, the maximum will be graphed. (Note: In the lab example it is probably the same since the disk really has not been touched) Your configuration should look like:
Creating Your First CloudWatch Alarm
1. Navigate to CloudWatch by clicking here, click on Alarms>All Alarms in the left pane:
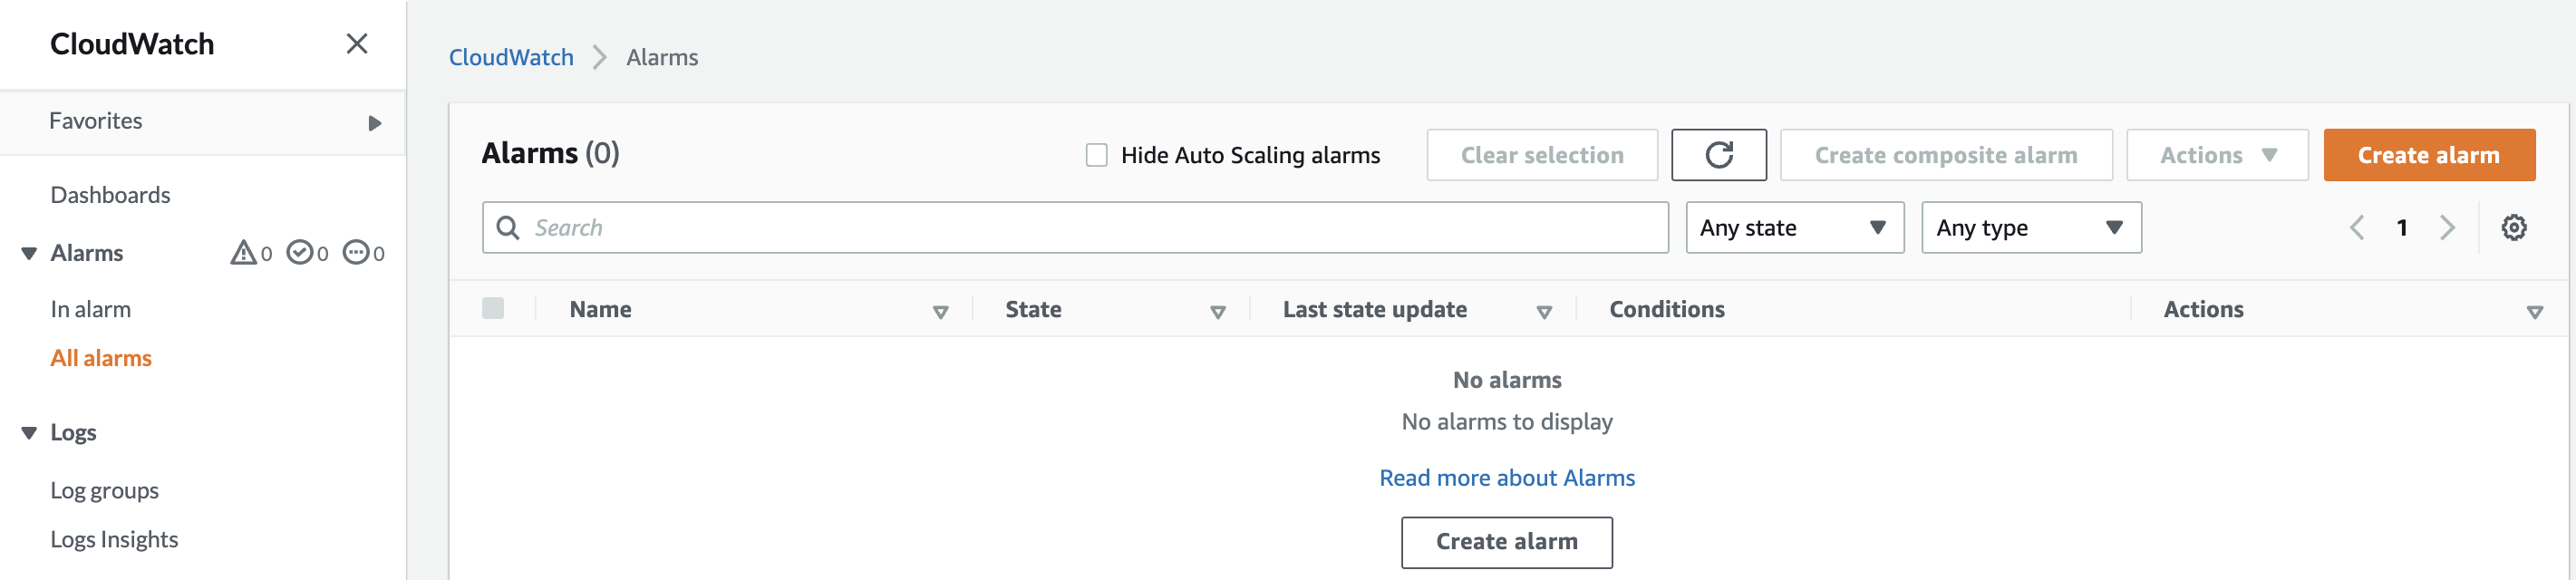
There are no Alarms configured, so there are no records found. Further, the three types of Alarms are all at zero (0).
Note: More information on Alarm states will be covered soon.
2. Click Create Alarm and click Select metric. Select the EC2 namespace:
Many different metrics are displayed for both the HighCPUInstance and the Monitoring Scripts instances.
3. Click Per-instance metrics, scroll down and select the metric with HighCPUInstanceunder Instance NameandCPUUtilizationunder Metric Name:
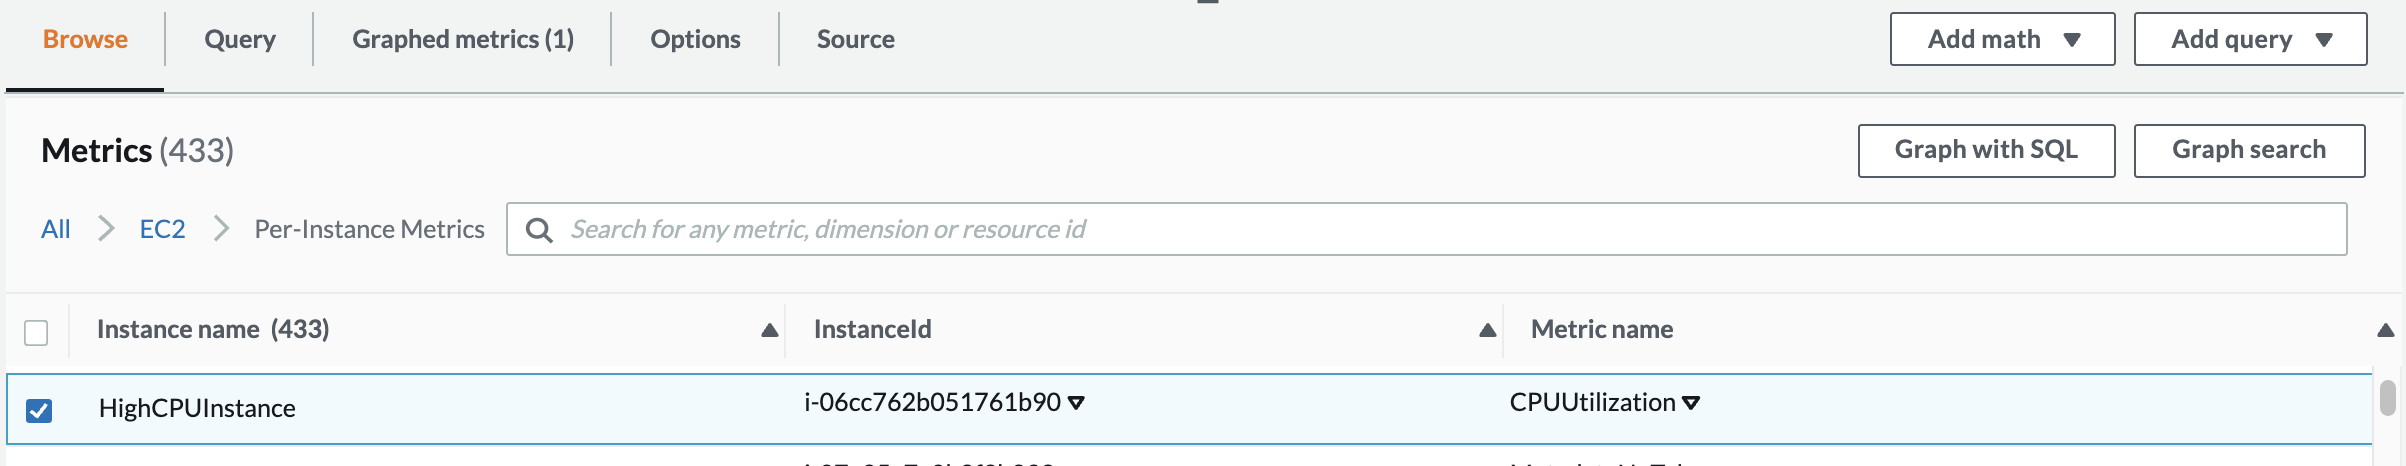
Tip: You may need to use the arrows in the upper right to find the HighCPUInstance on another page. Alternatively, you can make note of the last 3 or 4 characters in the InstanceId from the EC2 console, then enter those in the Search Metrics field. The search applies to all pages of information.
Once selected it is graphed immediately. Notice that you could tailor the graph to a specific Time Range (upper-right). For example, the time range can be specified in Relative or Absolute terms.
4. Click Select metric when ready.
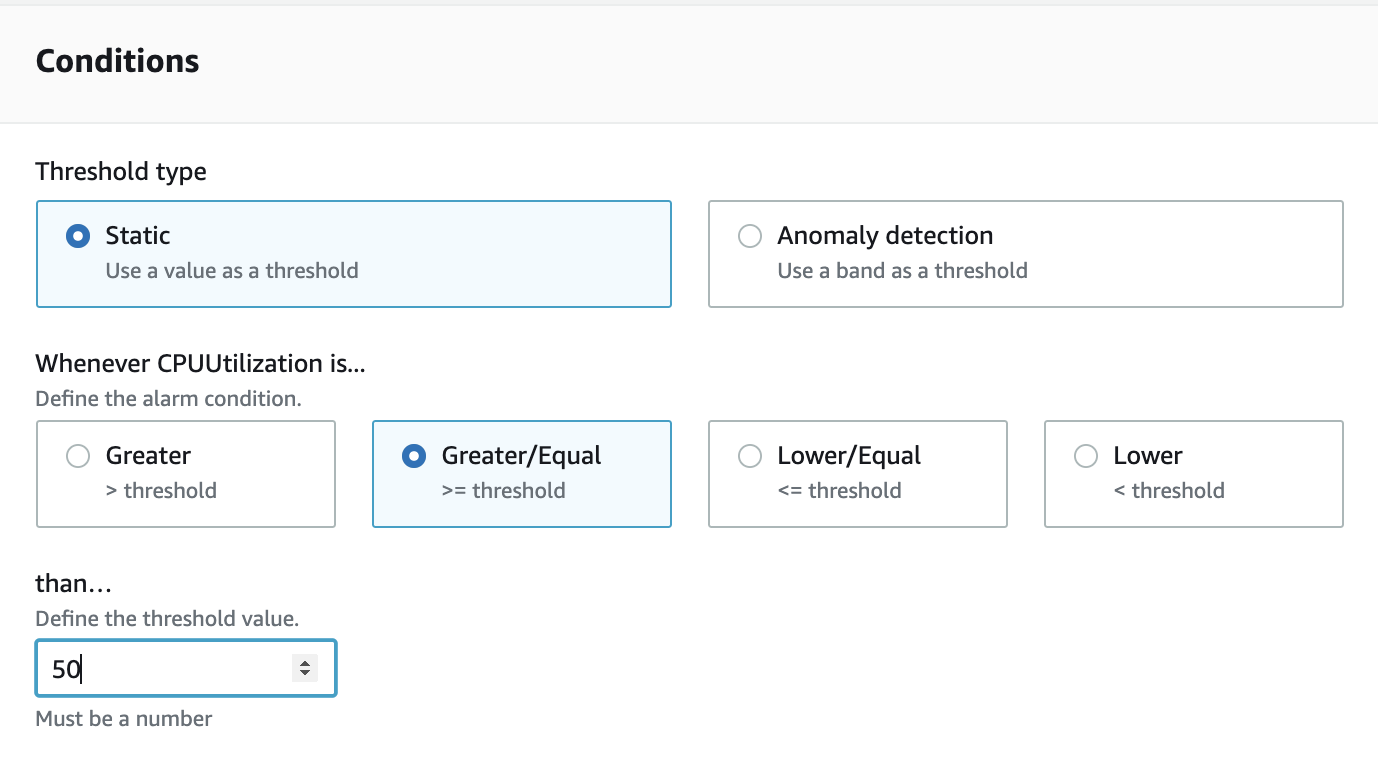
5. Under Conditions, set the following values leaving the defaults for the rest:
- _Whenever High CPU is…:_Greater/Equal
- Than…: 50
An alarm watches for a metric to go beyond an allowable value range when monitored over time. If violated the alarm’s state is changed. There are three possibles states for an alarm:
OK—The metric is within the defined threshold
In alarm—The metric is outside of the defined threshold
Insufficient data—The alarm has just started, the metric is not available, or not enough data is available for the metric to determine the alarm state
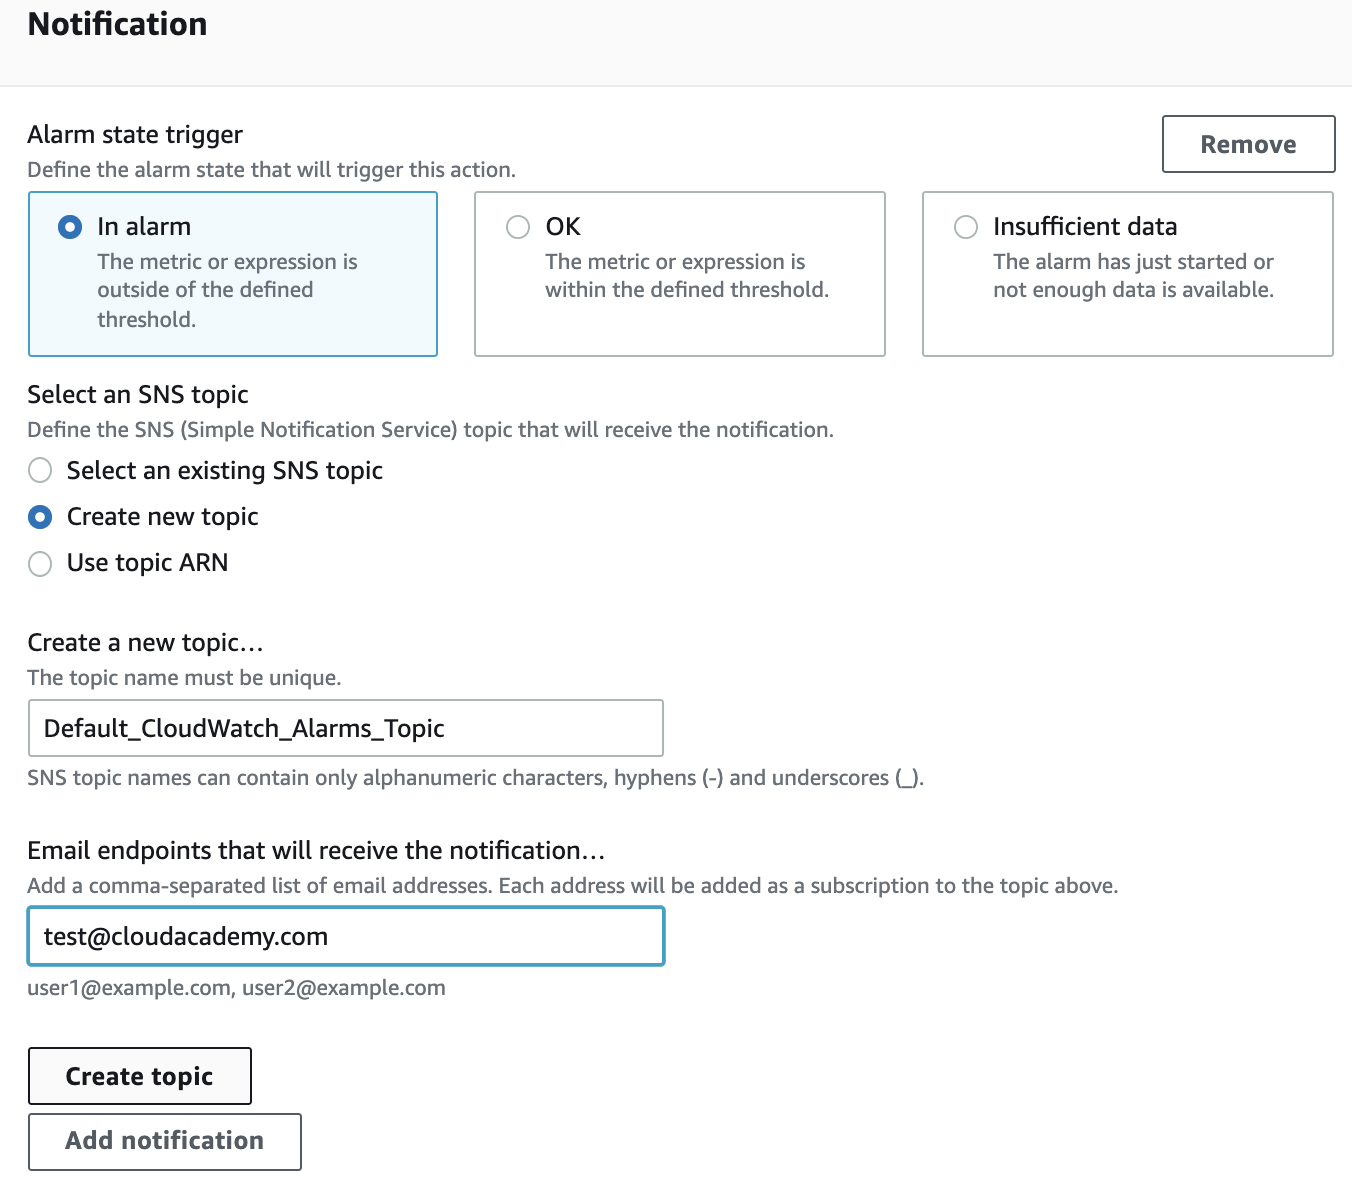
6. Click Nextand fill out the form as described:
- Alarm state trigger: In alarm
- **Select an SNS topic:**Create new topic
Insert a valid e-mail and click on Create topic.
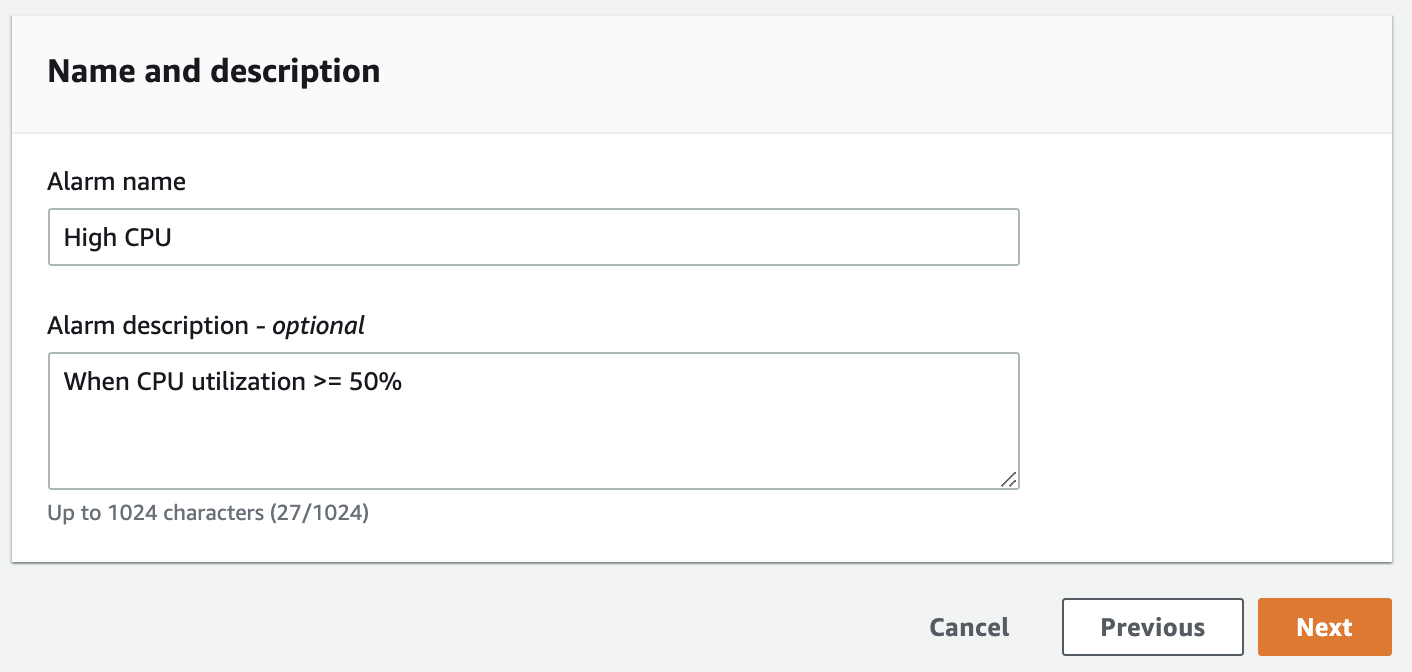
7. Click Next and fill the form as described before clicking Next:
- Define a unique name: High CPU
- Alarm description: When CPU utilization >= 50%
Tip: Be sure to use your valid email address in the Email list field so you can verify the Alarm later. AWS Simple Notification Service (SNS) is used to send the email when the alarm is triggered. However, you will not need to configure anything in SNS.
8. Click Create alarm when ready.
9. Check for an email from AWS Notifications. Open up the email and click the Confirm subscription link:
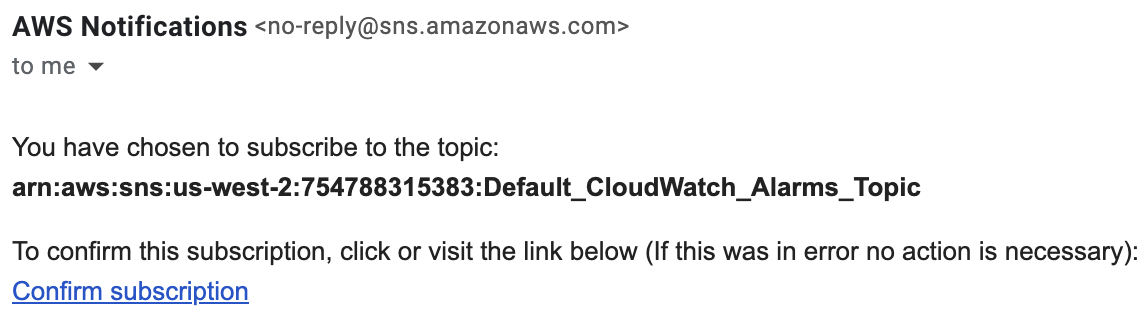
You should receive a subscription confirmation. (For example, a confirmation message from Amazon Simple Notification Service (SNS) in a new browser tab if using a browser-based email client like Gmail.) To summarize, you have created a new alarm, along with a new SNS topic. Since you subscribed to this new SNS topic, every time the state of the alarm switches to ALARM you will receive an email. You may not receive an alarm email if the time it took to confirm the SNS topic subscription took longer than the time it took for the alarm to trigger. Emails will only be sent to subscribers at the time of the alarm transition.
10. You should be put to the Alarm page:
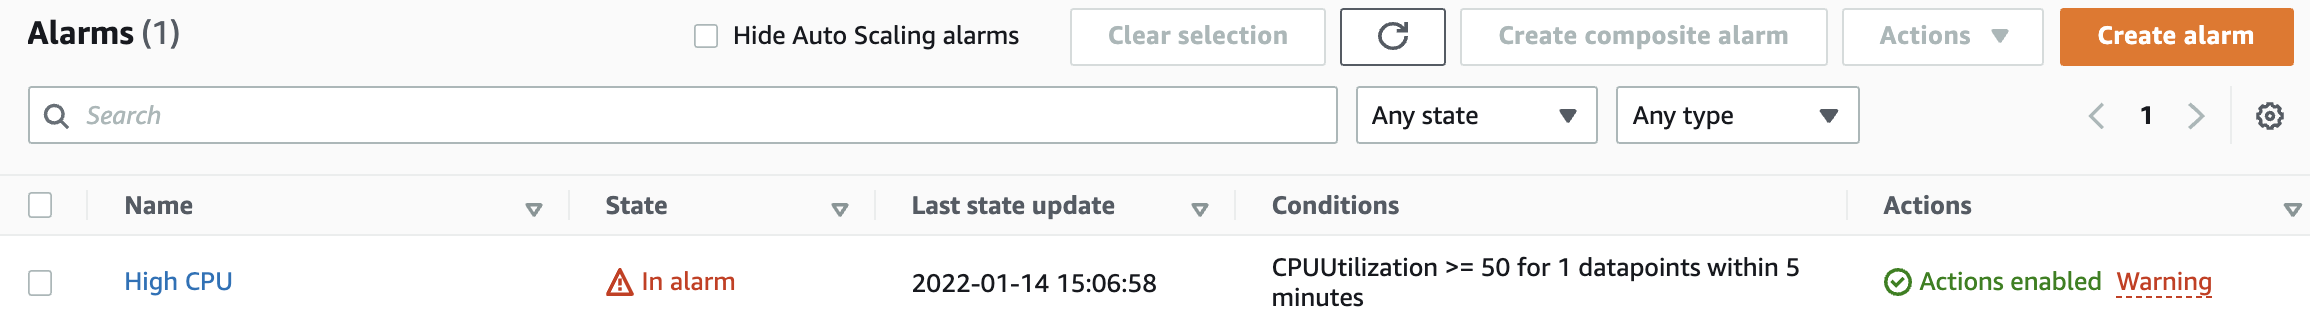
Note your Alarm state may differ. For example, you may be in an Insufficient datastate briefly and then transition either to In alarm or OK.
Troubleshooting Tip: If the state of your alarm does not change to In alarm almost immediately, it is probably because you picked the incorrect instance. The HighCPUInstance is designed to trigger an alarm due to a high CPU utilization metric. The Monitoring Scripts instance is not taxed at all. To remedy the situation you can either create a new alarm with the correct instance, lower the threshold to something artificially low (1), or change the >= to <= (which is not very realistic but will test the alarm).
11. Click the Alarm. You can see very useful information about the alarm itself. In the Details tab, there is a general overview of the alarm, and in the History tab you can see up to the last 50 states of the alarm:
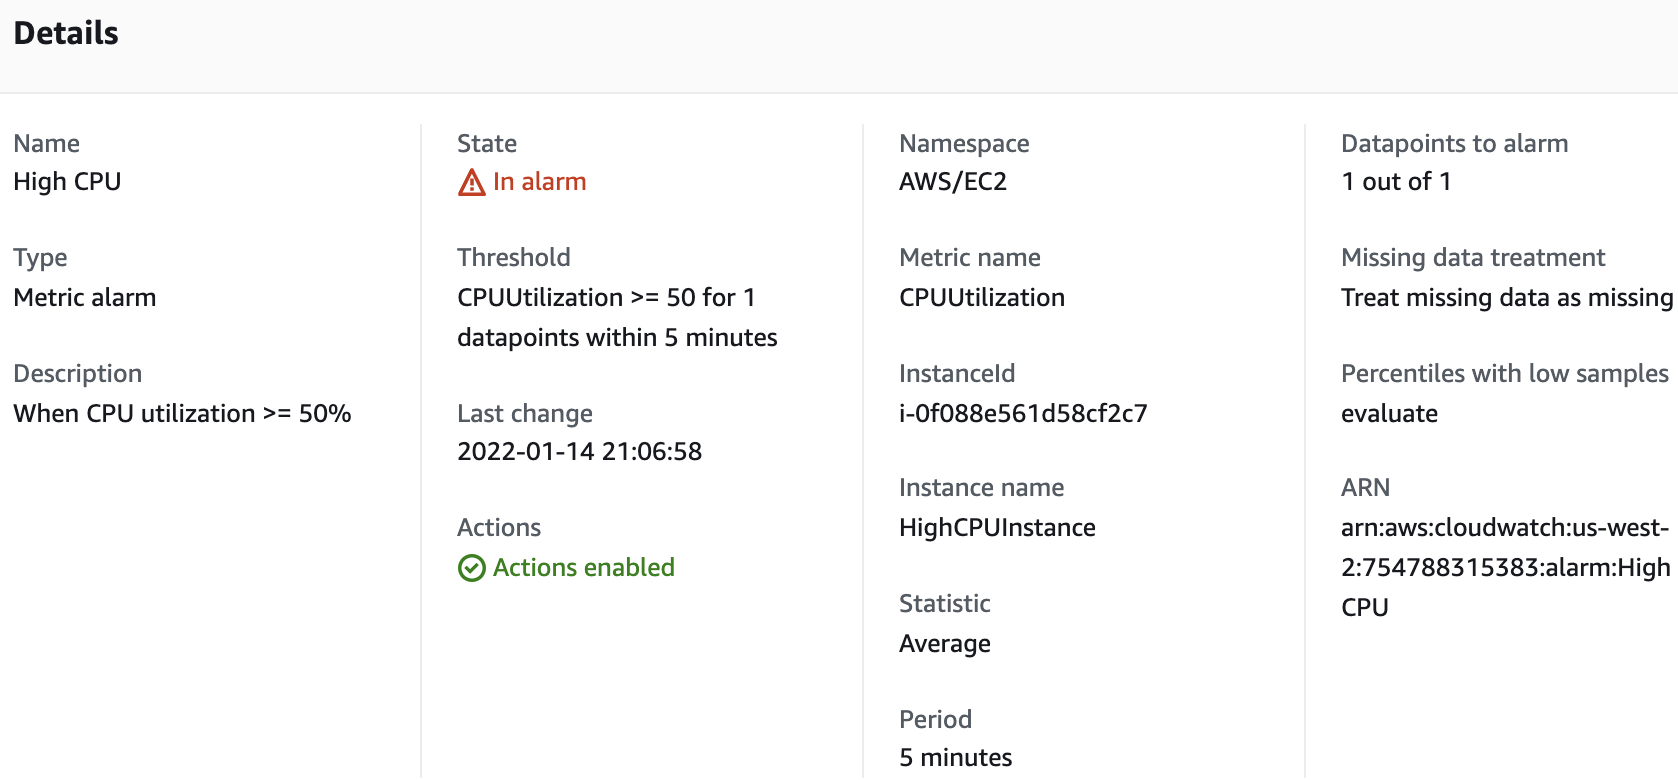
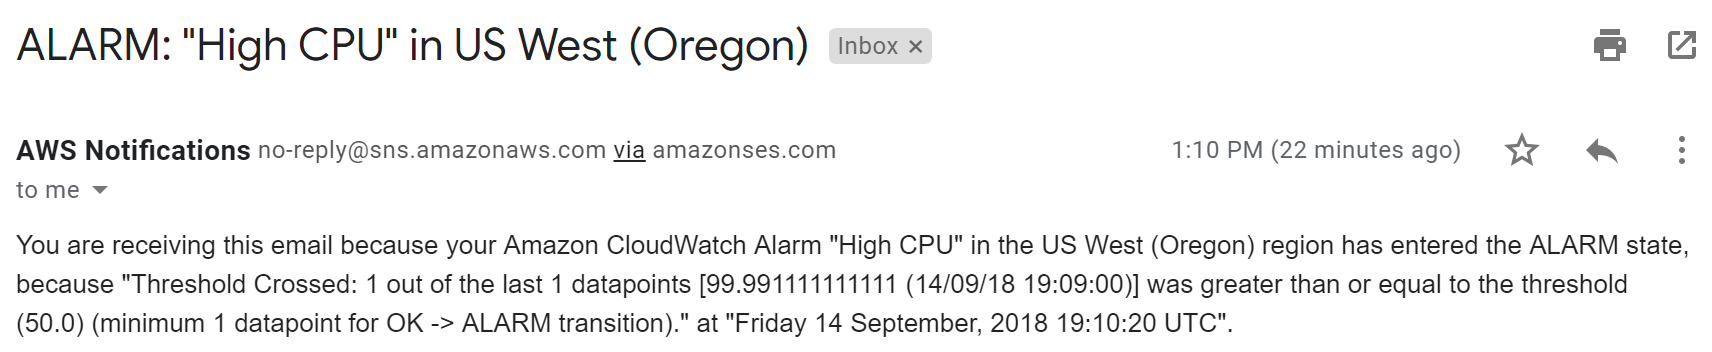
12. After an In alarmstate is raised, check for an email titled ALARM: “High CPU Alarm” in US West - Oregon from AWS Notifications.
Again, you may not have received an email because the alarm triggers before you had time to subscribe to the notification topic. Don’t worry, in the next Lab Step, you will reuse the topic for another alarm. Because you are already subscribed, you will receive an email. You could also retrigger the alarm by editing the alarm to trigger when CPUUtilization is >= 500 (which can never happen for the single CPU instance). Wait five minutes until the alarm is disabled, then edit the alarm to trigger when CPUUtilization >= 50.
13. Now move to the History tab:
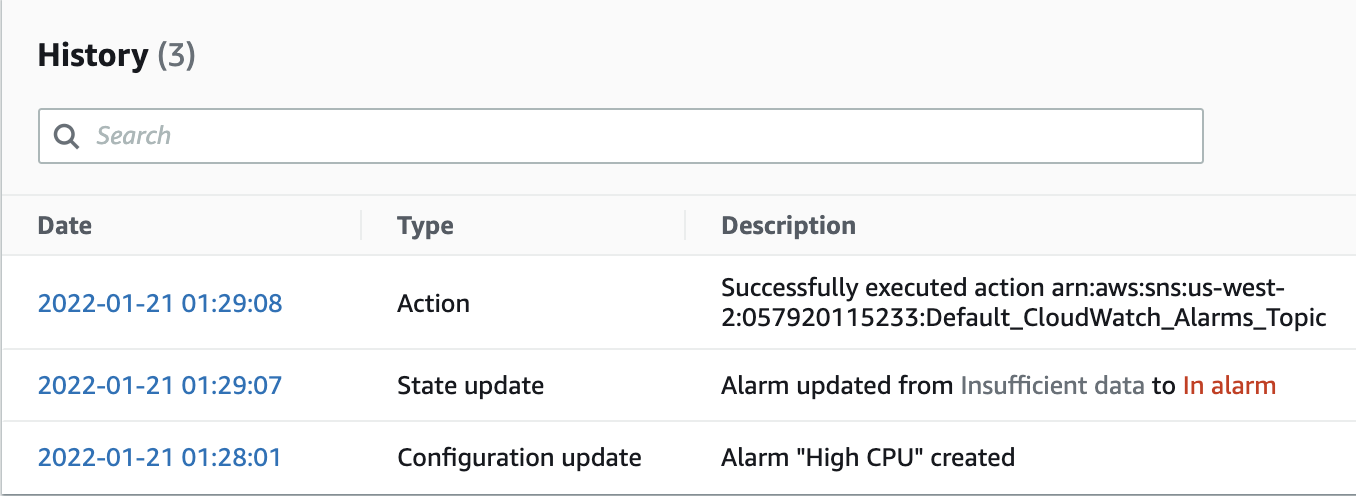
Your History is likely similar to the example shown above. The oldest event is the furthest down. In succession, the Alarm was created; the state changed from INSUFFICIENT DATA to ALARM; SNS sent off an email notification.
15. Spend a few minutes exploring the latest alarm history and try to understand what is going on with each entry. You can see more details for each entry by clicking the date.
Create an Alarm using the EC2 console
1. Navigate to EC2 Instances by clicking here.
2. Select the Monitoring Scripts instance, then switch to the Status Checks tab:
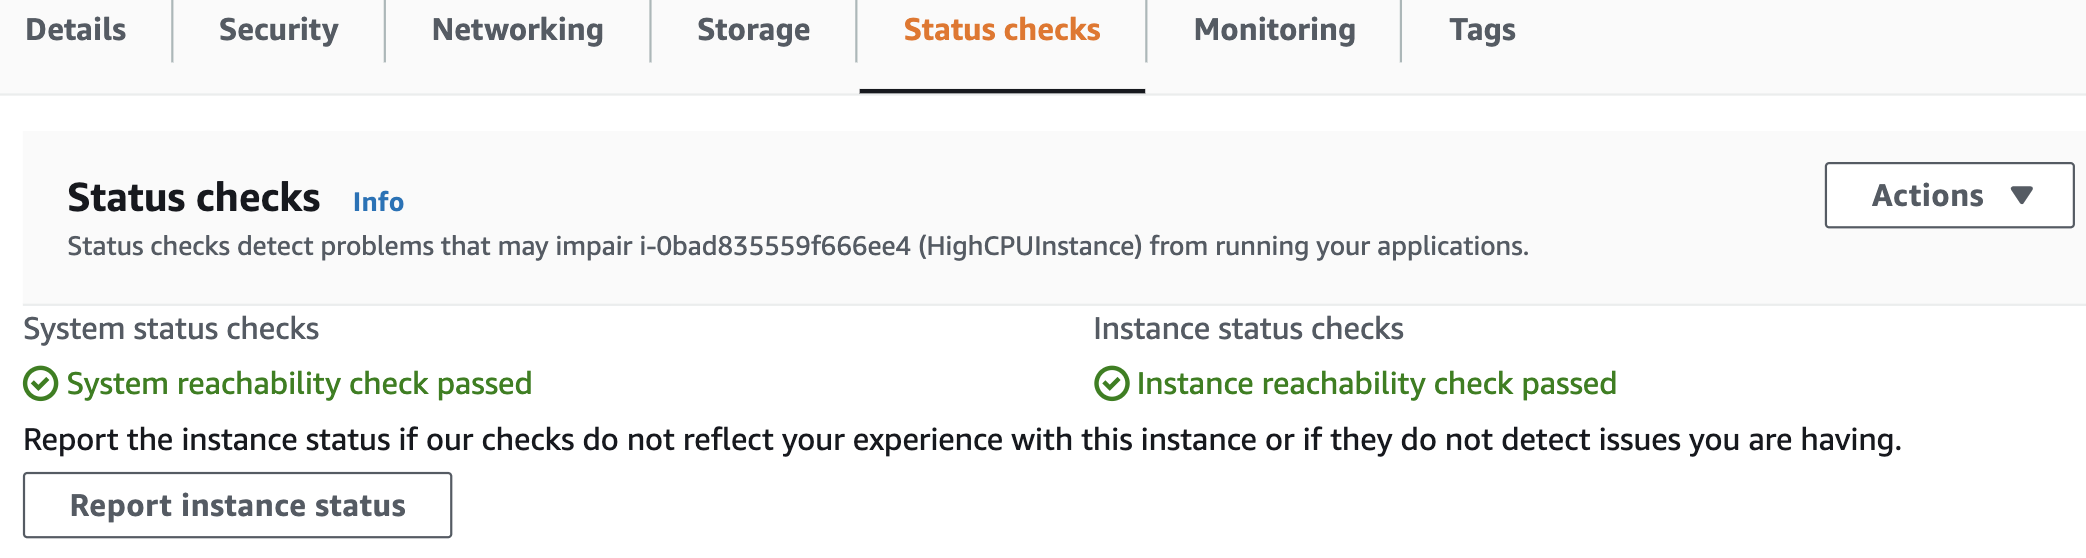
3. Click Actions> Create Status Check Alarm:
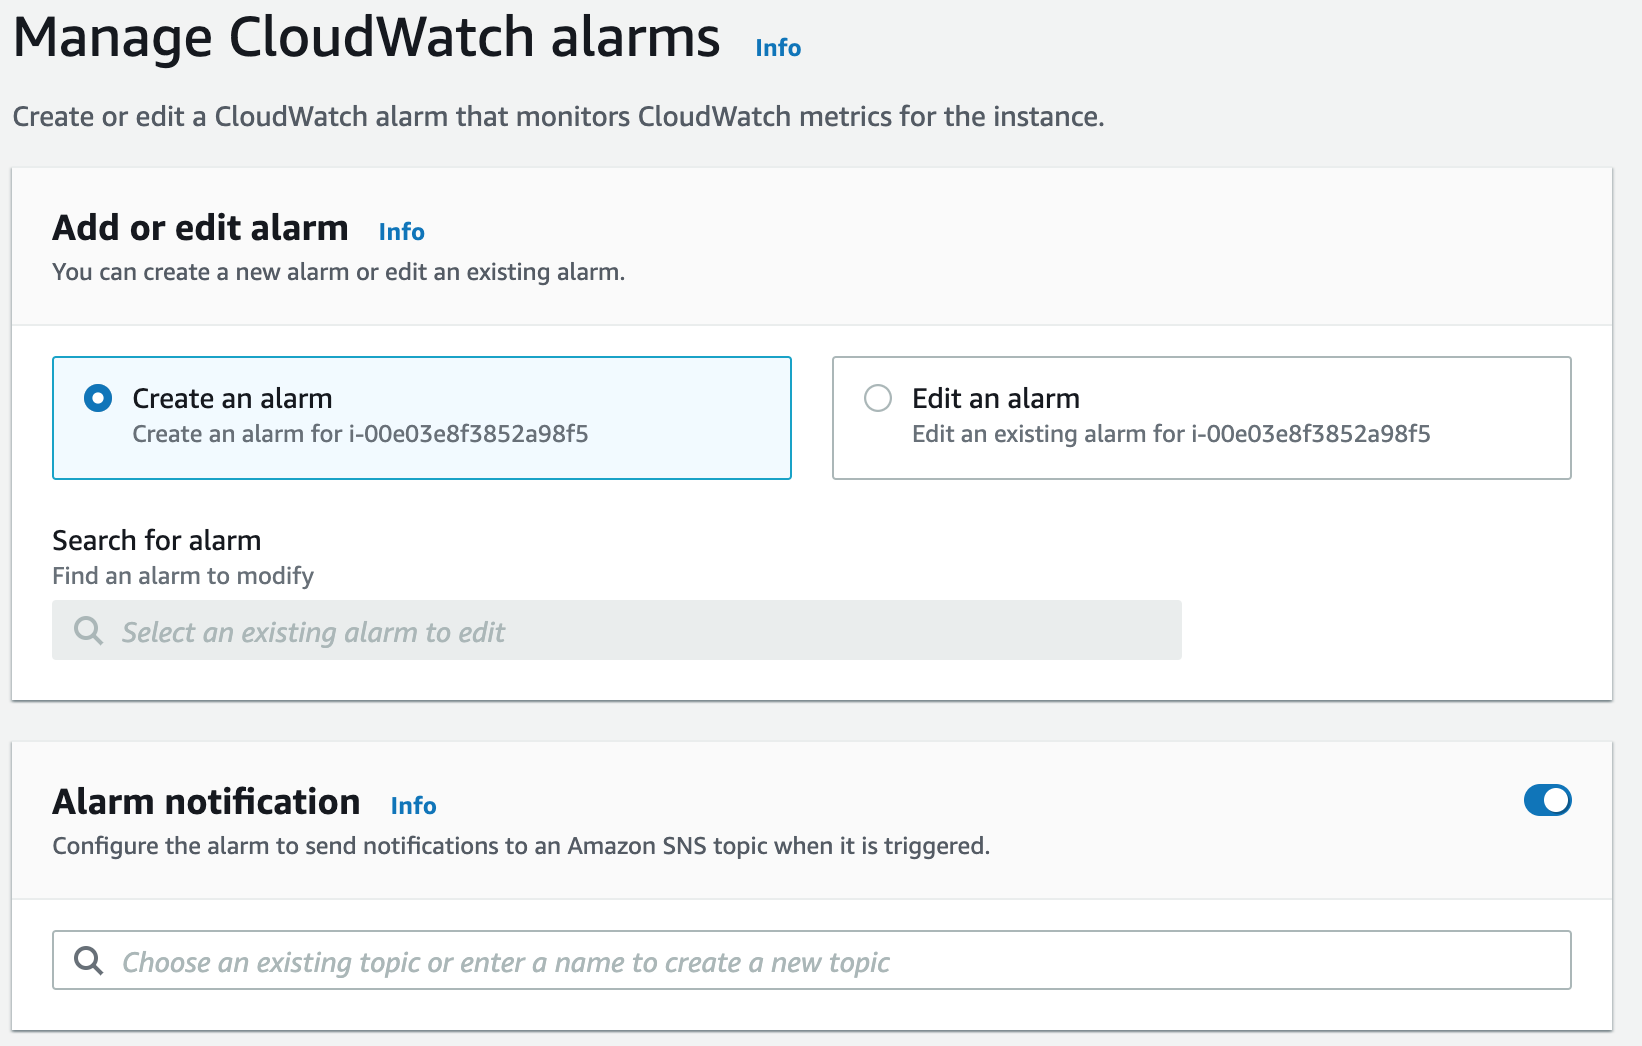
This dialog is similar in function to the create alarm wizard you saw in an earlier Lab Step.
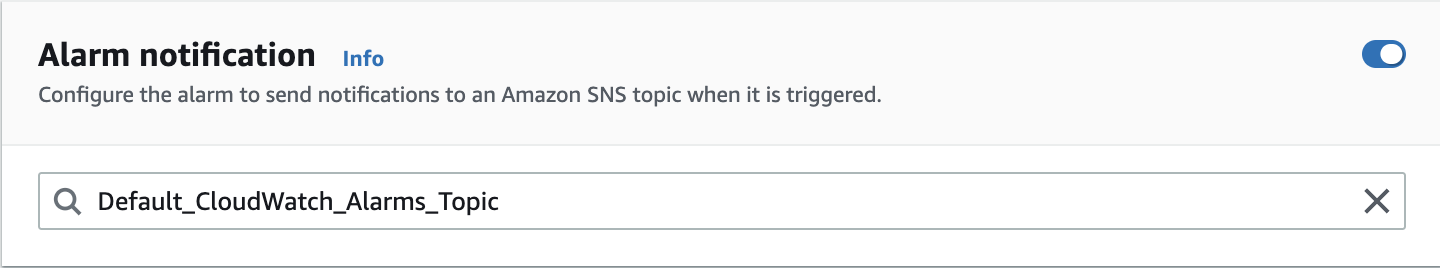
4. For the Alarm notification, select the SNS topic name you set up before.
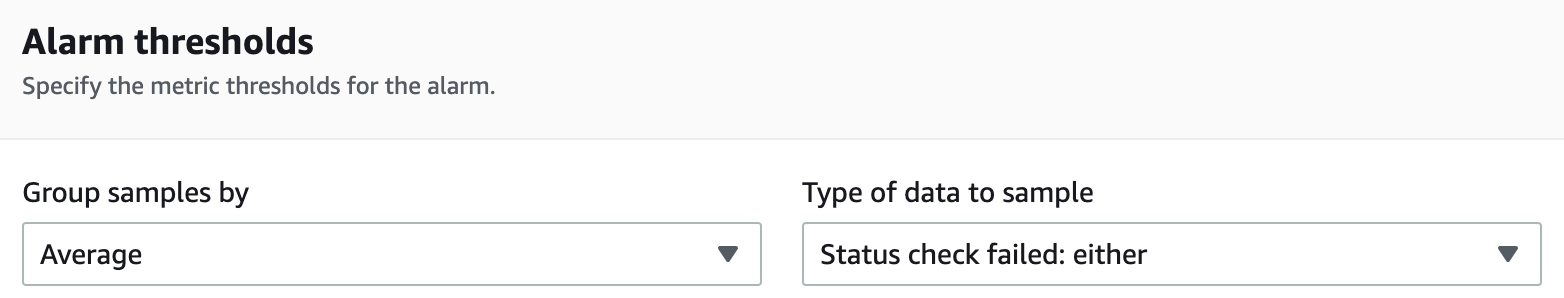
Other fields can be kept at their defaults. The Alarm thresholds section uses Status check failed: either to trigger the alarm for either instance or system status check failures:
5. Click Create when ready. An alarm creation confirmation message is displayed:

Now you know two different ways to create alarms: one from CloudWatch and the other from the EC2 console. Next, you will learn how to attach EC2 actions to alarms.
6. Return to the**Alarms by clicking here.**Notice that the first alarm you created is stuck in the In alarm state.
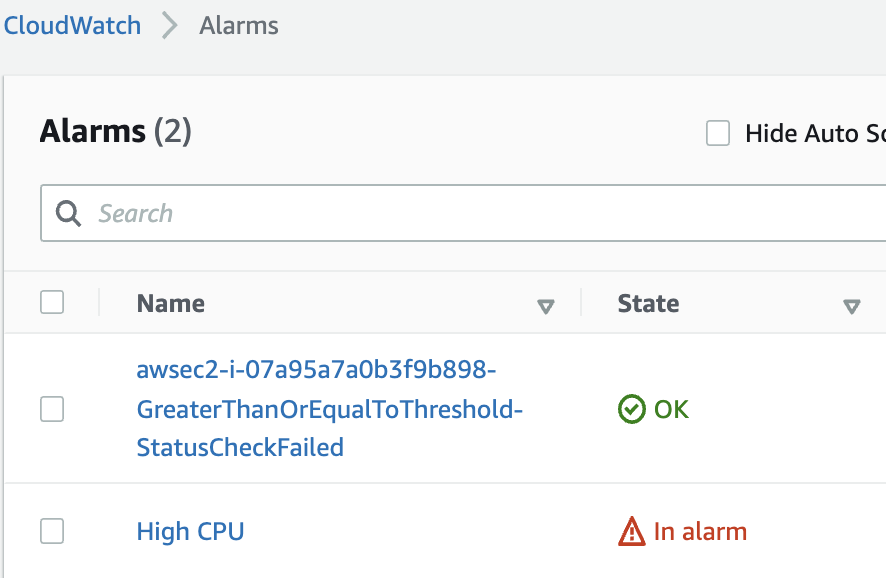
The alarm is stuck in the In alarm state because the instance is running an application that consumes 100% of the CPU utilization. Clearly an indicator that something may have gone wrong with the instance. Imagine that you are managing a production environment and you have an instance that is becoming unavailable intermittently because of high CPU utilization. You would like to receive a notification every time the CPU utilization is high, but this can happen anytime, in the middle of the night, or during a weekend or holiday. It would be helpful to have a pre-defined action in this case – at least until you find a definitive solution for the problem.
To help you address the scenario, you can set EC2 actions on your alarms.
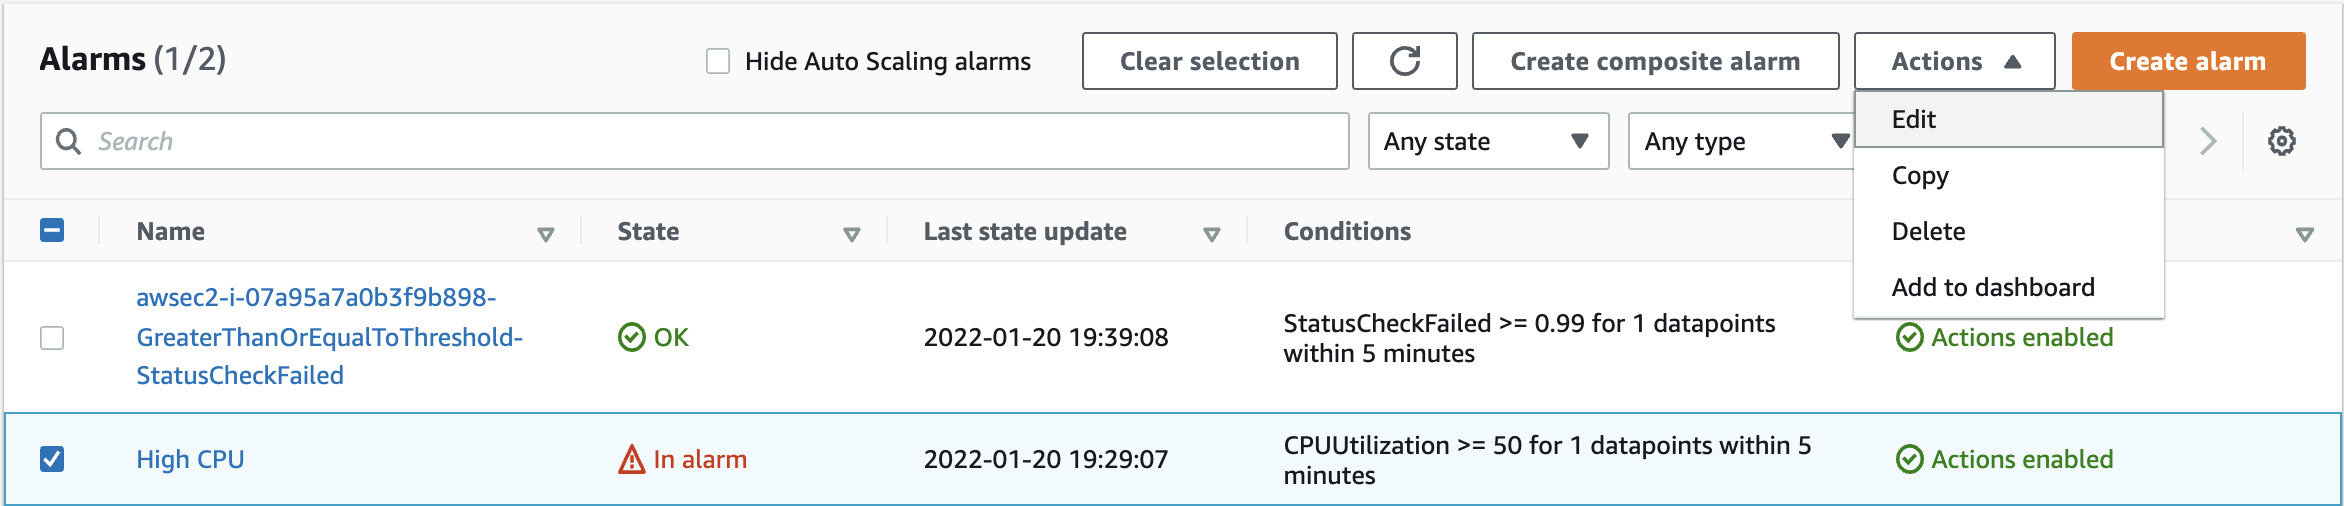
8. Select the High CPU alarm and then Actions > Edit:
To make your alarm more suitable to the training environment needs, set a new EC2 Action to Reboot this instance whenever the state of this alarm is ALARM.
9. Click on Next and click on Add EC2 actionunder EC2 action. Select Reboot this instance.
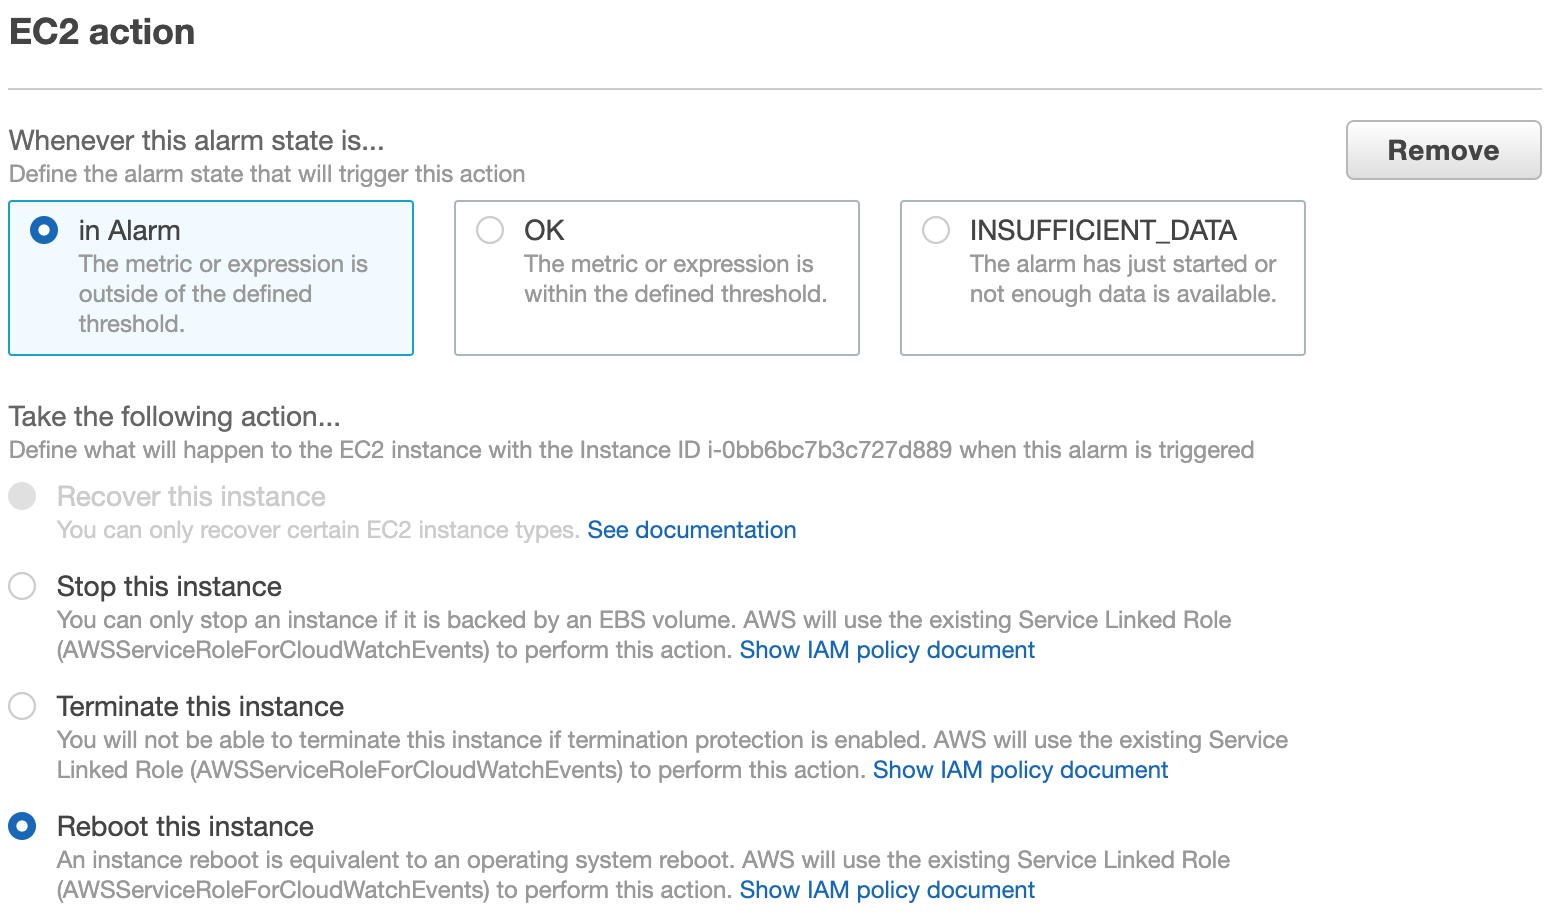
10. Click Update alarm when ready.
Although the changes have been made to the alarm, the alarm remains in the In alarm state. CloudWatch will only perform actions when the state transitions to the In alarmstate from another state. In the next instruction, you will modify the alarm to quickly have it change to the OKstate and then change it back to return to the In alarmstate.
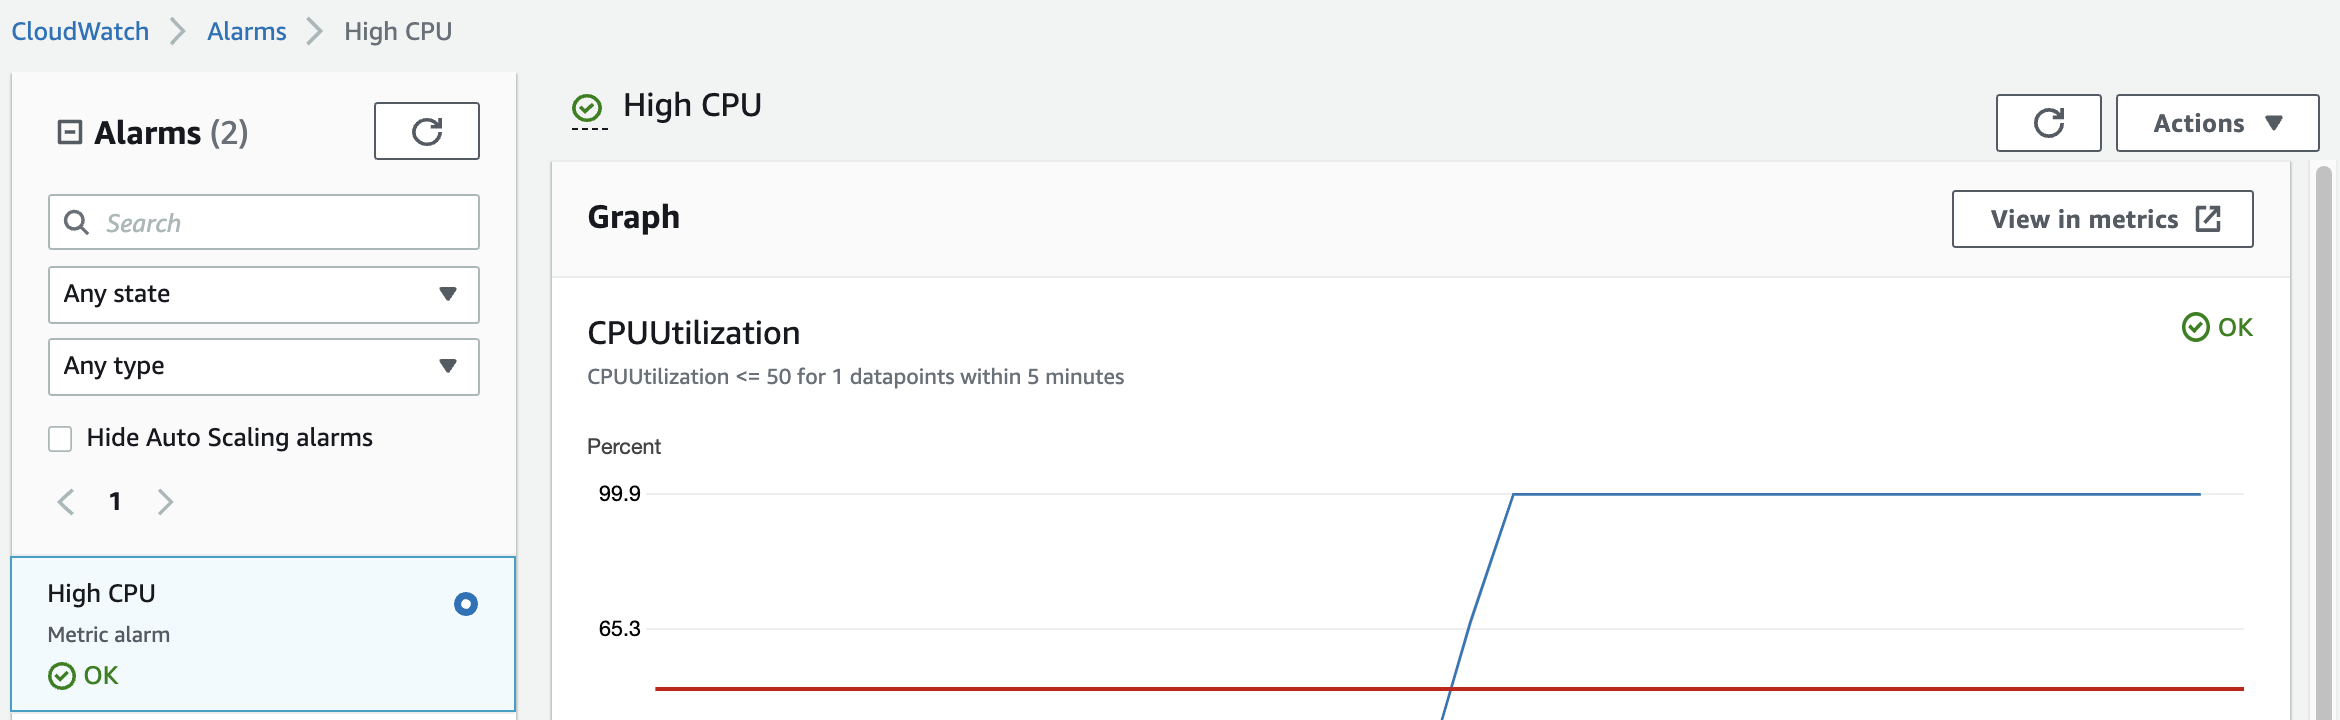
11. Select the High CPUAlarm and choose Actions > Edit. Toggle the relationship from >= to <= and click Update alarm:
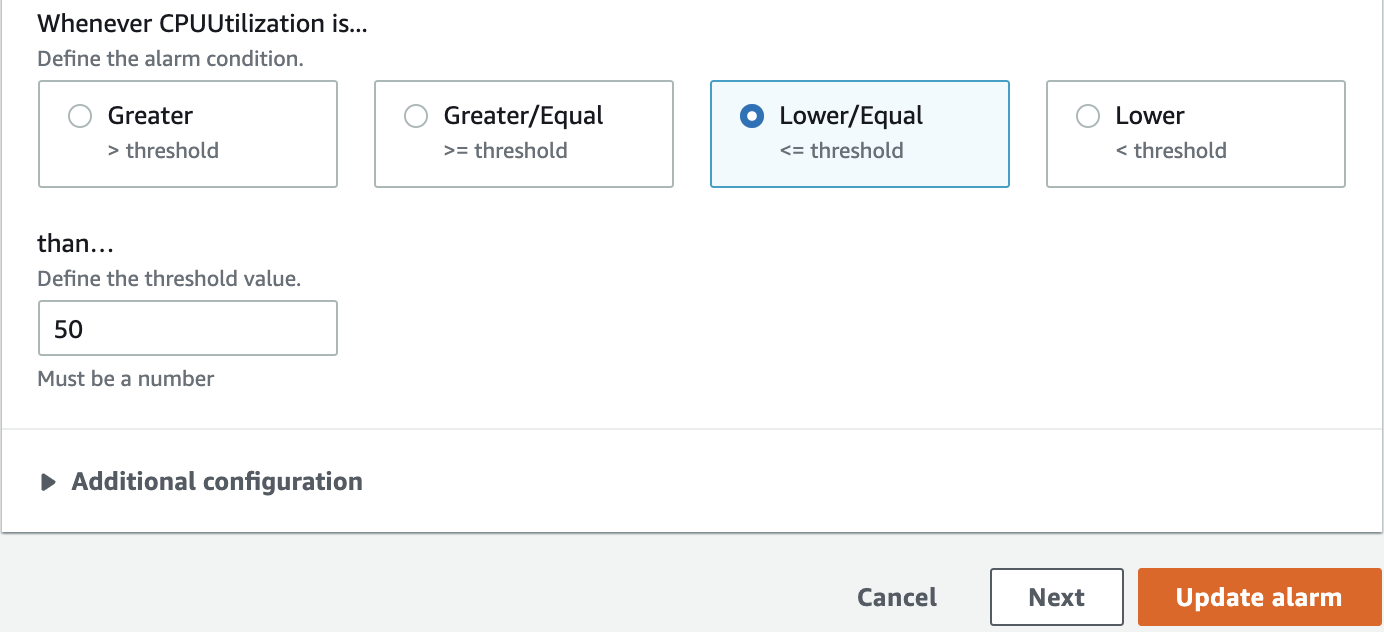
12. Refresh the page to ensure the alarm has transitioned to the OKstate. Then toggle the condition back to >= and save the alarm to have it transition to the In alarm state.
_Note:_The state change may not be immediate and may take up to 2 minutes.
13. Navigate back to the Instances by clicking here and watch CloudWatch reboot the instance when the Alarm Status changes to In alarm.
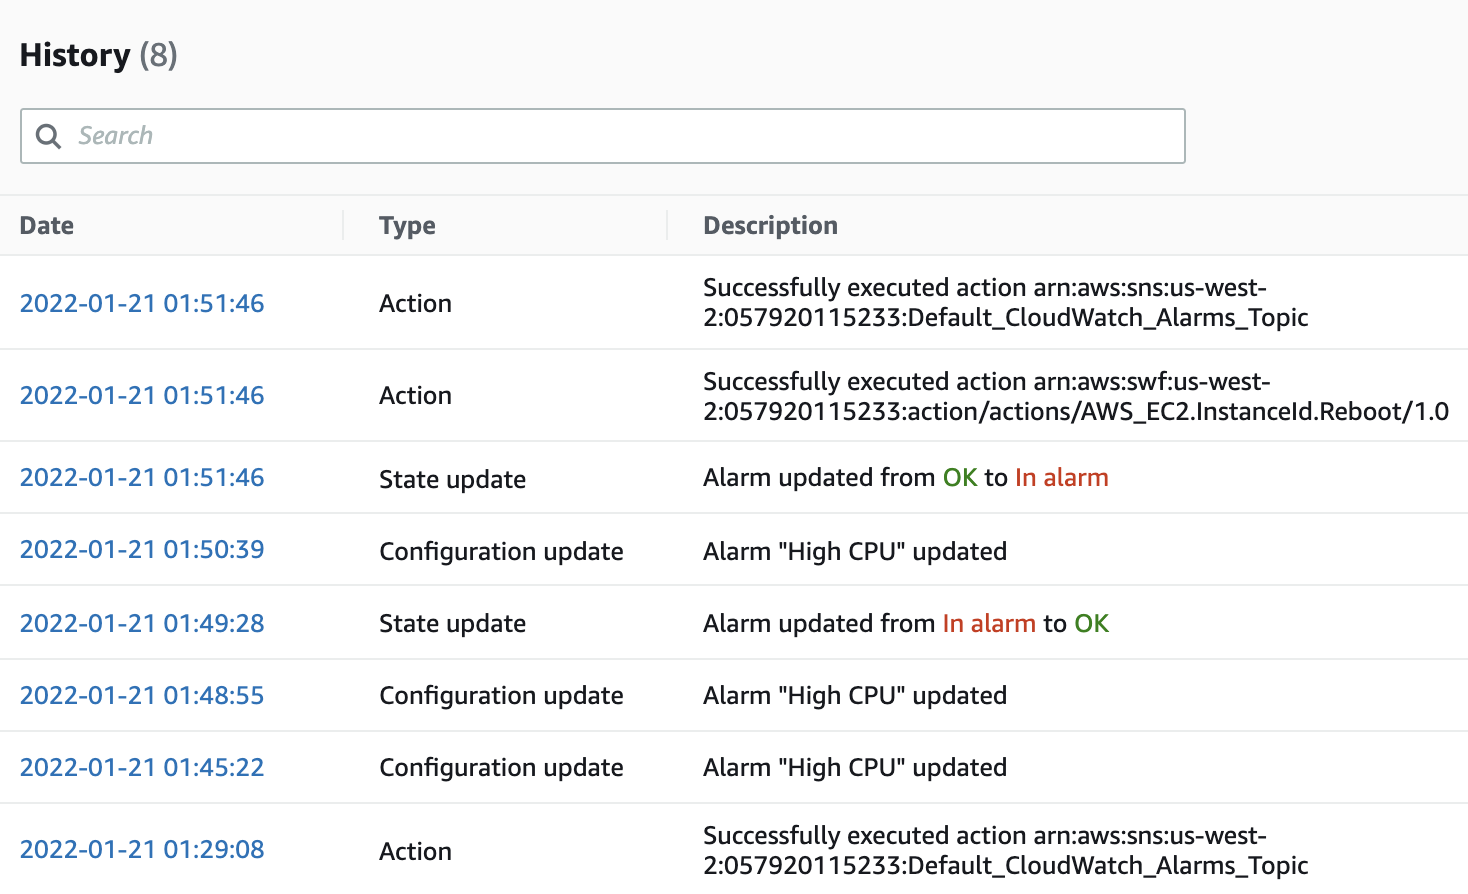
In case you miss it, you can return to the alarm in CloudWatch and see the Reboot Action listed in the Historysection:
14. Check your email client and confirm that you received a notification of the alarm:
Sharing CloudWatch Metrics with others
1. Go to CloudWatch by clicking here and click on Metrics> All metrics.
2. Select an interesting metric, such as the DiskspaceUtilization metric for the Monitoring Scripts instance, and click Actions > Share:
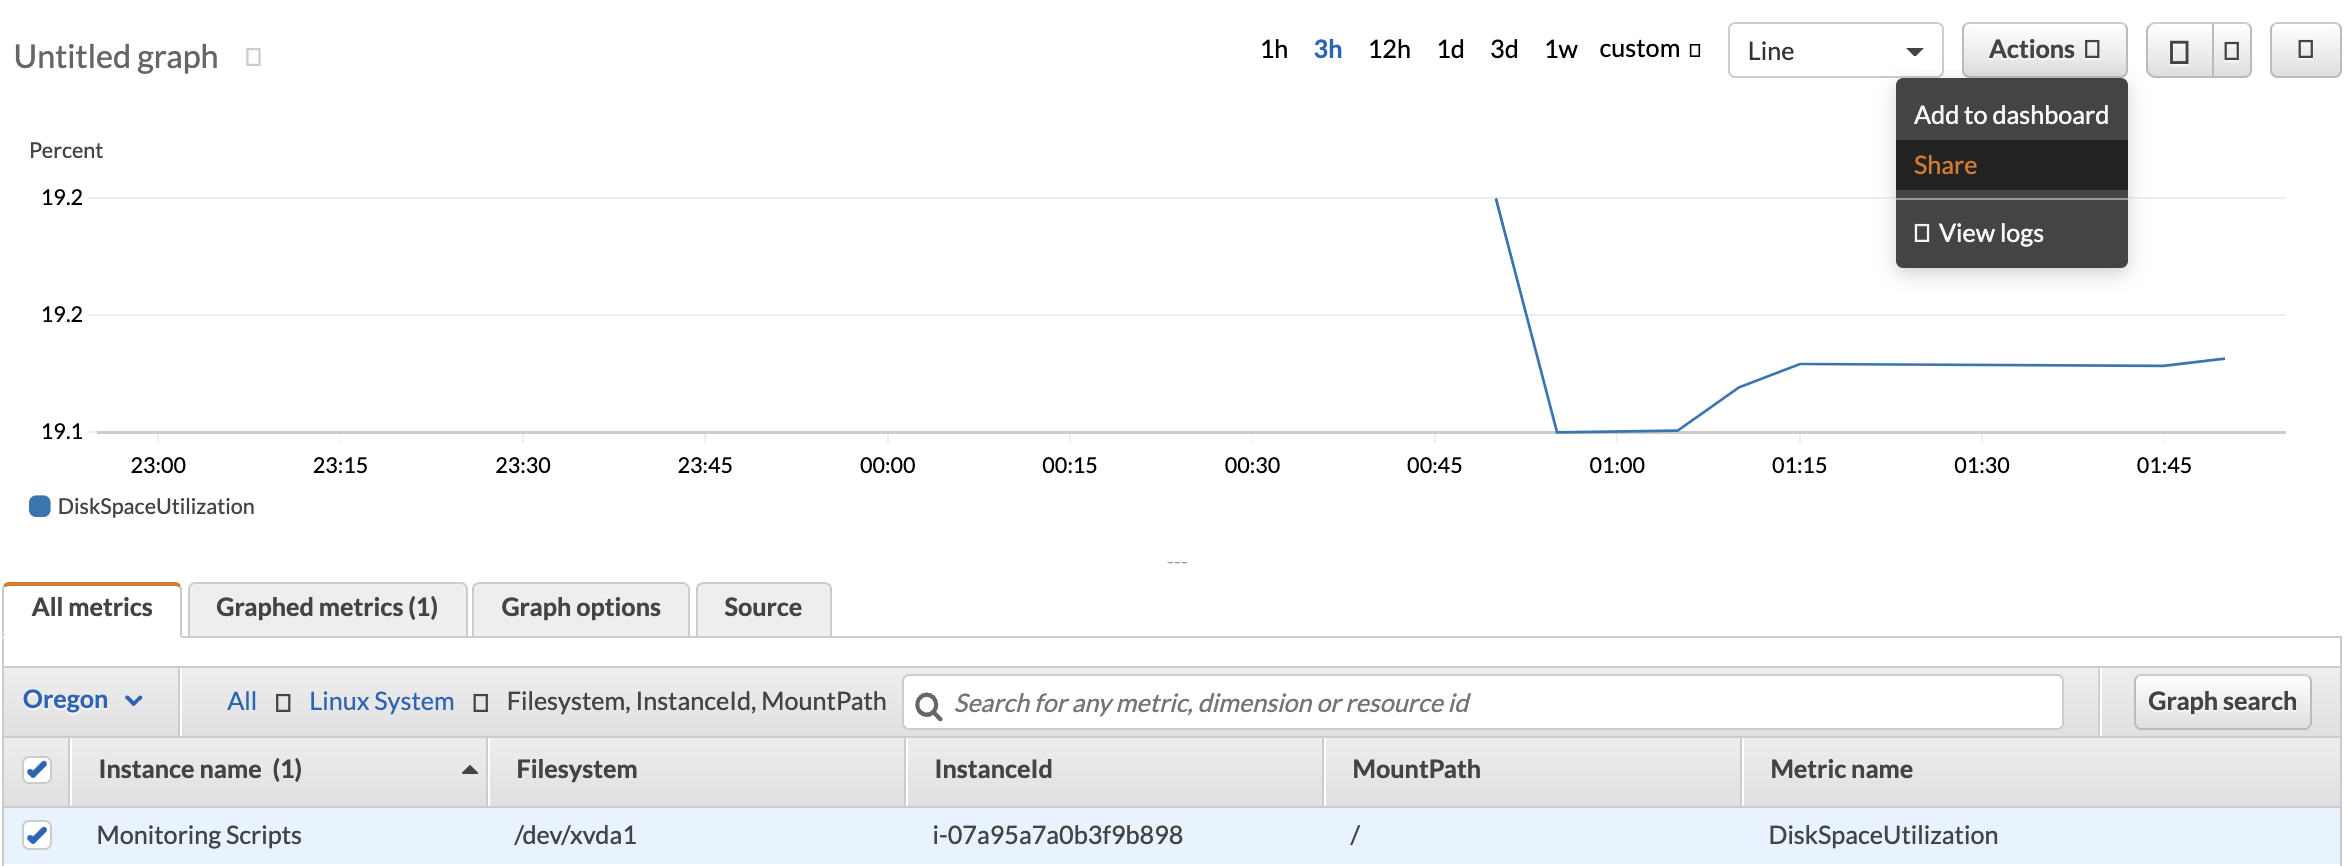
This metric can be found underSystem/Linux > Filesystem, InstanceId, MountPath.
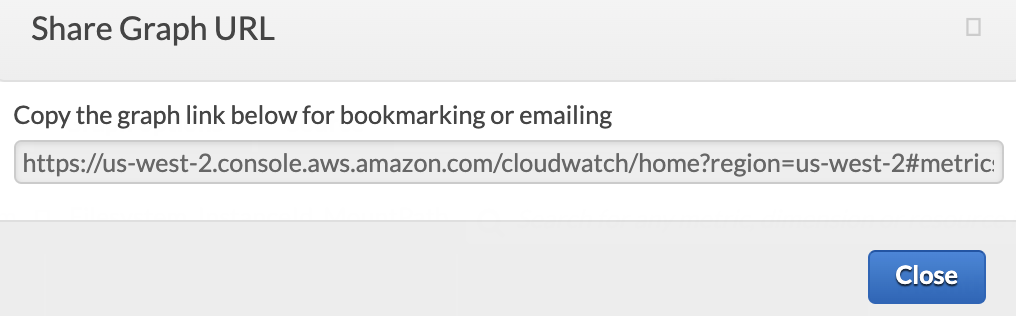
3. In the Share Graph URL dialog, right-click and copy the URL, then Close the dialog:
4. The URL for the specific graph you were looking at is copied into the clipboard. You can paste it into a test email to confirm this. For example:
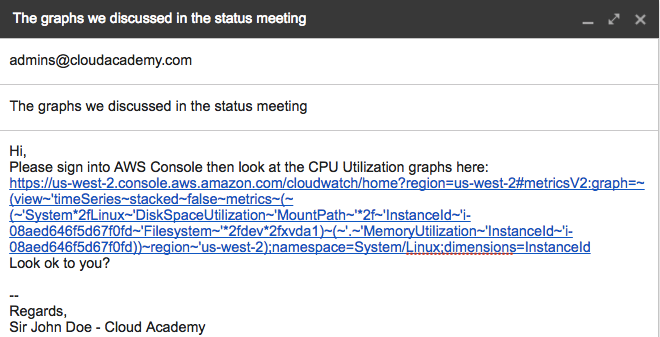
The URL is quite complex. To confirm that it is indeed correct, test it out in another browser tab.
5. Open another browser tab. Paste the URL into the address field and refresh your browser. You should see the exact same graph as the one you shared earlier. Notice that you need to be logged into the AWS console in order to view the information referenced by the URL. For security reasons, you can only share URLs with other AWS Identity and Access Management (IAM) users who have the appropriate CloudWatch IAM permissions in your AWS account.